Difference between revisions of "DCOM Volume I Appendix K"
| (17 intermediate revisions by the same user not shown) | |||
| Line 1: | Line 1: | ||
| − | == | + | == APPENDIX K: DESIGN OF DAMS FOR WATER SOURCES== |
| − | K.1 Introduction | + | '''K.1 Introduction'''<br> |
| + | In this Appendix, the following condensed information has been provided in order to assist design engineers to design dams that are expected to provide water for domestic use, to support livestock as well as for commercial and some industrial use. However, it should be borne in mind that the major water demand will be for domestic and livestock use. Furthermore, in Tanzania, majority of the existing dams for water sources are earthfill dams and only a few are rockfill dams. Furthermore, where a water source comes from a concrete dam, the primary purpose of that dam was for hydropower generation and hence the dam design is undertaken by the respective power generation agency. The Appendix has been broken into 20 sections that include:<br> | ||
| + | * Types of Dams, | ||
| + | * Dam and Reservoir Pre-Surveys and Detailed Studies, | ||
| + | * Reconnaissance of Potential Dam Sites, | ||
| + | * Empirical Methods for Capacity Evaluation of Dam Construction Sites, | ||
| + | * Preliminary Data Collection (Pre-design), | ||
| + | *Designs of Earth-fill Dams, | ||
| + | * Height of the Dam, | ||
| + | * Design of the Embankment Filter | ||
| + | * Check of the Rip-rap Adequacy for the Safety of the Structure, | ||
| + | * Seepage and Stability Analysis of the Earth-fill Dams, | ||
| + | * Sediment Yield in the Catchment, | ||
| + | * Estimation of Evaporation from the Reservoir, | ||
| + | * Different Types of Spillways, | ||
| + | *Freeboard (Fb) Estimation, | ||
| + | * Estimation of Freeboard due to wave action (fwave), | ||
| + | * Embankment Crest Width (W), | ||
| + | *Embankment Slopes, | ||
| + | * Design Requirements for Tailings Storage Facility (TSF) | ||
| + | * Dam Break/Failure Analysis, | ||
| + | * Design Drawings. | ||
| − | In this | + | '''K.2 Types of Dams'''<br> |
| − | + | The general choice of a dam will depend to a large extent on the site selected for it. There are mainly three general types of dams that include:<br> | |
| − | + | * Earthfill dams which also includes rockfill dams; | |
| − | + | * Concrete and Masonry dams; | |
| − | + | * Sub-surface dams. | |
| − | + | ||
| − | + | In the case of earthfill dams, the pressure exerted by their weight spreads over | |
| − | + | a much greater area by virtue of having flatter embankment slopes. A rockfill | |
| − | + | dam consists of an embankment made of stones of irregular sizes and shape | |
| − | + | faced either with concrete or masonry earth and clay. Concrete dams require | |
| − | + | foundations of much greater bearing pressure (strength) than earthfill dams | |
| − | + | which can be more easily constructed. A slight settlement in the foundation of | |
| − | + | a concrete or masonry dam may give rise to fractures whereas the same can | |
| − | + | often be well accommodated in the earth-fill dams. Technically, concrete dams | |
| − | + | are rigid structures while earthfill and rockfill dams are deformable structures. | |
| − | + | Because concrete dams are not common in water supply projects in Tanzania, no | |
| − | + | further discussion of these type of dams is presented in the manual. | |
| − | + | ||
| − | + | Sub-surface dams are usually constructed by excavating a trench within the | |
| − | + | sand-bed of a river during the dry season which is then filled with impervious | |
| − | + | material that may or may not be zoned. Further design specifications of dams | |
| + | for water sources focus on earthfill dams. Rock-fill and earth-fill dams are | ||
| + | usually built in relatively broad valley sites because large-sized machines can | ||
| + | be operated efficiently in such sites. The selection of the dam type should be | ||
| + | carefully made, firstly basing this on materials procurable at the dam site or in | ||
| + | the neighbourhood, and secondly in case of fill type and where this can be found. | ||
| + | Rain and temperature greatly affects the work period available. | ||
| + | |||
| + | A flood spillway is an indispensable part of any dam structure and therefore its | ||
| + | size, type and the natural conditions involved in its layout often proves to be a | ||
| + | governing factor in the selection of dam type. Because of the cost of spillways | ||
| + | and the high sediment load in main watercourses, designers should always look | ||
| + | at the possibility of off-channel storage sites on tributaries as these can often | ||
| + | prove to be the more cost effective alternative, even though they often involve | ||
| + | pumped storage. | ||
| + | |||
| + | '''K.3 Dam and Reservoir Pre-Surveys and Detailed Studies'''<br> | ||
| + | Pre-surveys are required to be undertaken for each of the factors listed below. Subsequent to the pre-surveys, detailed studies have to be conducted on each of the following aspects: | ||
| + | |||
| + | a) Precipitation and reservoir evaporation<br> | ||
| + | b) Inflow of sediments from main and any of the tributary rivers<br> | ||
| + | c) Planned highest water levels<br> | ||
| + | d) Watershed surroundings<br> | ||
| + | e) Water quality<br> | ||
| + | f) Topographical data<br> | ||
| + | g) Geology of the area<br> | ||
| + | h) Foundation characteristics<br> | ||
| + | i) Preliminary location and hydraulic analysis of the spillways<br> | ||
| + | j) Water demand and use conditions<br> | ||
| + | k) Choice of the most suitable dam site. | ||
| + | |||
| + | '''K.4 Reconnaissance of Potential Dam Sites'''<br> | ||
| + | A suitable site for a good reservoir shall depend upon the following factors:<br> | ||
| + | a) Geological condition of the catchment area should be such that percolation losses are minimum and favors only maximum runoff.<br> | ||
| + | b) The reservoir site should be such that quantity of leakage through it should be minimum. Reservoir sites having highly permeable rocks reduce water tightness of the reservoir. Good types of rocks that may not allow passage of much water includes shale, slates, schist, gneiss's, and crystalline igneous rocks such as granite.<br> | ||
| + | c) The dam should be founded on sound, water tight rock base, and percolation below the dam should be minimum. The cost of the dam is often a controlling factor in selection of the dam site.<br> | ||
| + | d) The reservoir basin should have a narrow opening in the valley so that the length of the dam is less.<br> | ||
| + | e) The cost of real estate for reservoir including road, rail road, dwelling relocation, etc must be as little as possible.<br> | ||
| + | f) The topography of the reservoir site should be such that it has adequate capacity without submerging excessive land and other properties.<br> | ||
| + | g) The site should be such that a deep reservoir is formed. A deep reservoir is preferable to a shallow one because of: | ||
| + | * Lower cost of land submerged per unit of capacity, | ||
| + | * Less evaporation losses because of reduction in the water spread area, | ||
| + | * Less likely hood of weed growth. | ||
| + | h) The reservoir site should be such that it avoids or excludes water from those tributaries which carry a high percentage of silt in water.<br> | ||
| + | i) The reservoir site should be such that the water stored in it is suitable for the purpose for which the project is undertaken. The soil and rock mass at the reservoir site must not contain any objectionable soluble minerals and salts (Punmia et al., 2010). | ||
| + | |||
| + | '''K.5 Empirical Methods for Capacity Evaluation of Dam Construction Sites'''<br> | ||
| + | The cross sections of the proposed dam sites are usually plotted after acquisition of data from the field by using horizontal interval and the elevations taken by GPS during reconnaissance. The plotted cross sections will show that, there is a potentiality of building a dam of a certain type and at different heights and embankment lengths. The proposed dam sites may face different challenges including a small catchment area and hence poor water yield that can fill the dam, catchment degradation due to different human activities and hence sediment transport challenges along the river valleys. etc. All these challenges have to be well addressed during design. Usually the proposed dam sites have to be refined during detailed design phase as they may be shifted on either side downstream or upstream for appropriate dam axis setting with respect to appropriate dam heights and their capacities. | ||
| + | |||
| + | Through site verification, a number of potential dam sites can be identified and verified with their initial capacities being empirically computed. Three empirical methods may be used to make rough estimation of the reservoir capacities and these are illustrated as methods 1, 2 and 3 as described in the next paragraphs. The appropriate dam capacities will further be appropriately determined by using contours during the detailed survey stage of undertaking the project. Materials for construction (sand, gravel and stones) of such water storage facility are to be investigated and if possible to be cheaply and locally available within the project sites with clearly noted distance from the respective sites in-line with the specifications as presented in Chapter Twelve of the Volume I of the DCOM Manual. | ||
| + | |||
| + | '''K.5.1 Method No.1: Queensland Water Resources Commission'''<br> | ||
| + | |||
| + | Capacity for each dam site is estimated basing on appropriate empirical formula to get initial guess of the expected potential storage volume for each dam. The reservoir capacity is worked out based on empirical formula estimation as per the Queensland Water Resources Commission method (cited by Nkuba, 2009). The Commission developed a method which involves determining the shape of the gully/valley slice across section and then selecting a corresponding shape from a list each of which has its own co-efficient between 0.5 and 1.6 as illustrated in Figure K.1. | ||
| + | |||
| + | [[File:K1.JPG|729px|link=DCOM_Volume_I_Appendix_K]] <br> | ||
| + | |||
| + | [[File:FigureK1.JPG|730px|link=DCOM_Volume_I_Appendix_K]] <br> | ||
| + | |||
| + | '''K.5.2 Method No.2: Best Practice from FAO Experience'''<br> | ||
| + | Reservoir storage capacity can alternatively be estimated basing on field | ||
| + | experience of FAO as follows (FAO, 2010): | ||
| + | |||
| + | [[File:K2.JPG|728px|link=DCOM_Volume_I]] <br> | ||
| + | |||
| + | 6 is a factor (generally conservative) that can be adjusted (to 5 or 4) with experience | ||
| + | and local knowledge. All the parameters in method 2 can be determined by the | ||
| + | use of a level or theodolite (or any accurate GPS equipment) at the site. The | ||
| + | capacity estimated in this way is accurate to within about 20 percent, but it | ||
| + | must be revised by a more detailed survey when the site has been approved | ||
| + | for possible construction. The formula considers the water volume to be an | ||
| + | inverted pyramid with a triangular surface area (LT/2) and H/3 for the height/ | ||
| + | depth, and is a simplification of reality. With experience, one is able to judge fairly | ||
| + | accurately how an individual valley will compare with such an idealized picture | ||
| + | and therefore, to adjust the resulting conclusions (FAO, 2010). | ||
| + | |||
| + | '''K.5.3 Method No.3: Nelson Equation'''<br> | ||
| + | Nelson (1991) equation as cited by Nkuba (2009) is one of the recommended | ||
| + | equations for quick dam capacity estimations. | ||
| + | |||
| + | [[File:K3.JPG|732px|link=DCOM_Volume_I_Appendix_K]] <br> | ||
| + | |||
| + | '''K.6 Preliminary Data Collection (Pre-design)'''<br> | ||
| + | K.6.1 Geotechnical Investigations<br> | ||
| + | In all major Civil Engineering projects, geotechnical investigations are important | ||
| + | in guiding designers on the most essential items to be considered. This important | ||
| + | item may only take 0.25 - 1% of the whole cost of the project. Such investigation | ||
| + | is required to give detailed information on the following aspects (Punmia et al., | ||
| + | 2010):<br> | ||
| + | (a) Water tightness of the reservoir Basin,<br> | ||
| + | (b) Suitability of the foundation for the Dam,<br> | ||
| + | (c) Geotechnical and structural features including; folds, faults, fissures, | ||
| + | lineaments etc., of the underlying rock at the site,<br> | ||
| + | (d) Type and depth of overburden (superficial deposit),<br> | ||
| + | (e) Location of permeable and soluble rocks, if any,<br> | ||
| + | (f) Ground water conditions in the region,<br> | ||
| + | (g) Location of quarry sites and other sources for materials to be used for dam<br> | ||
| + | construction and the estimated quantities of the intended materials,<br> | ||
| + | (h) Study of the geology for the catchment area as it has effects on the runoff | ||
| + | and percolations,<br> | ||
| + | (i) The geology of the dam site is important from the point of view that it secures | ||
| + | the foundation for the dam,<br> | ||
| + | (j) There should be special requirements for the geology of the reservoir site | ||
| + | such that there is no danger of serious leakage when the ground is under | ||
| + | pressure from the full head of water in the reservoir,<br> | ||
| + | (k) The nature of the sub surface geology should be explored by trial bores or | ||
| + | various means of geological explorations.<br> | ||
| + | |||
| + | '''K.6.2 Catchment Yield'''<br> | ||
| + | The total quantity of surface water that can be expected in a given period from a | ||
| + | stream at the outlet of its catchment is known as the "yield" of the catchment in | ||
| + | that period. In determining the catchment potential in yield to the dam reservoir, | ||
| + | some basic factors are usually considered. Such factors include catchment area, | ||
| + | catchment characteristics and the designed maximum flood expected to pass | ||
| + | through the spillway during extreme events. | ||
| + | |||
| + | '''K.6.3 Topographical Surveys'''<br> | ||
| + | This stage is executed when the site is suitable for dam construction and already | ||
| + | being confirmed against its potential to store enough water. Topographical | ||
| + | surveys will include contours generation after taking the ground levels as | ||
| + | per directed intervals by the Engineer. It is important to take the levels at the | ||
| + | reservoir area and locations of the spillway, other related infrastructure with the | ||
| + | dam, appropriate contours, and spatial arrangement of facilities with readable | ||
| + | scale. Propose survey control points for horizontal and vertical movements of the | ||
| + | embankment, baseline information, propose spacing and bench marks usually | ||
| + | away from the Tailings Storage Facility (TSF) embankment. Some of the relevant | ||
| + | and popular equations which may be used for volume computation include using | ||
| + | areas covered by the contours and those include the following: | ||
| + | |||
| + | [[File:K4567.JPG|725px|link=DCOM_Volume_I_Appendix_K]] <br> | ||
| + | |||
| + | '''K.6.4 Catchment Area'''<br> | ||
| + | Catchment area estimation is nowadays done by digitizing the map of the project | ||
| + | area, using GIS computer based tool (Arcview, ArcGIS, etc.). The total catchment | ||
| + | area for each dam site catchment is normally computed in sq. km-unit. | ||
| + | |||
| + | '''K.6.5 Flood Estimation for Dam Design'''<br> | ||
| + | Some of the existing popular methods used for flood estimation include the | ||
| + | following: | ||
| + | (a) Envelope curves,<br> | ||
| + | (b) Empirical formulae,<br> | ||
| + | (c) Physical indication of past floods,<br> | ||
| + | (d) Rational method,<br> | ||
| + | (e) Probable Maximum Precipitation (PMP) chart,<br> | ||
| + | (f) Rating curves or rating equations,<br> | ||
| + | (g) Unit hydrograph method,<br> | ||
| + | (h) Flood frequency analysis,<br> | ||
| + | (i) Frequency distribution functions.<br> | ||
| + | |||
| + | Out of all these methods, the five (5) commonly used ones include empirical | ||
| + | formula, rational method, unit hydrograph method, Flood frequency analysis | ||
| + | and Frequency Distribution Functions. However flood frequency analysis and | ||
| + | frequency distribution functions methods based on probability and statistics | ||
| + | are the most favourable and these give quite reliable flood values compared | ||
| + | to the rest of the methods. Frequency Distribution Functions for extreme flood | ||
| + | prediction values include the following:<br> | ||
| + | * Gumbel’s extreme value distribution, | ||
| + | * Log Peason Type III distribution, | ||
| + | * Log normal distribution.<br> | ||
| + | These have been further discussed in Chapter Three of Volume I of the DCOM | ||
| + | Manual. | ||
| + | |||
| + | '''K.6.6 Estimation of Discharge for Charco and Small Dams'''<br> | ||
| + | '''(a) Mean Annual Runoff''' | ||
| + | The Mean Annual Runoff (MAR) can be estimated from a dam catchment | ||
| + | conventionally by being expressed as an equivalency of runoff depth, in mm. The | ||
| + | simplest method of estimating mean annual runoff is to apply a runoff coefficient | ||
| + | to the mean annual runoff as illustrated below. | ||
| + | |||
| + | MAR=ROC*MAP................................................................ (8)<br> | ||
| + | Where:<br> | ||
| + | MAR = Mean annual runoff<br> | ||
| + | MAP = Mean annual precipitation (mm)<br> | ||
| + | ROC = Runoff coefficient<br> | ||
| + | |||
| + | This approach is used in many of the simpler small dam design manuals, where | ||
| + | for semi-arid areas the runoff coefficient is often set at 0.1. Runoff depends | ||
| + | on many parameters in addition to rainfall and this is recognized in some | ||
| + | procedures, which adjust the runoff coefficient to account for land forms, soil | ||
| + | type and drainage, and cover etc. This approach requires a considerable quantity | ||
| + | of catchment specific data that will be not readily available to most small dam | ||
| + | designers (Nkuba, 2009). | ||
| + | |||
| + | '''(b) Mean Annual Flood Peak Discharge'''<br> | ||
| + | A spillway must be designed to pass the design flood without damage, and the | ||
| + | peak flood without the dam overtopping, i.e. the peak flood must be contained | ||
| + | within the dry freeboard. The design has to be checked by ensuring that the 250 | ||
| + | year return flood can be passed without the dam overtopping i.e. without the | ||
| + | additional head needed exceeding the dry freeboard. Using regional frequency | ||
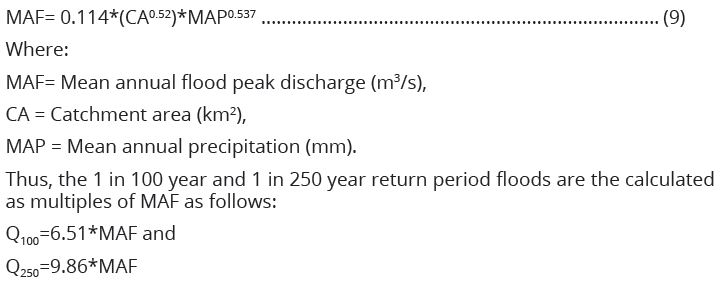
| + | method, the mean annual peak flood (MAF) is estimated as follows (Nkuba, 2009): | ||
| + | |||
| + | [[File:K9.JPG|725px|link=DCOM_Volume_I_Appendix_K]] <br> | ||
| + | |||
| + | '''(c) Specific Yield of the Catchment'''<br> | ||
| + | The majority of earth dam failures (around 90%) in the world are due to underdesigned | ||
| + | spillway or under estimated floods which cause overtopping of the | ||
| + | embankment followed by erosion of the downstream slope and finally the | ||
| + | breaching of the embankment. Consequently, obtaining accurate figures for | ||
| + | the flood expectations is the most important part of the design from the safety | ||
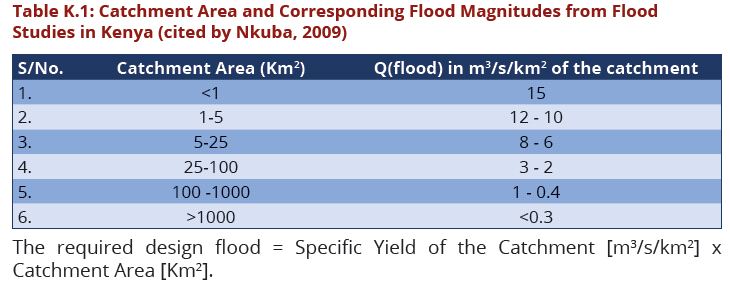
| + | point of view. Figures in Table K.1 are for Q100 or 100 year return period from | ||
| + | flood studies in Kenya as cited by Nkuba (2009). These should be used with great | ||
| + | personal judgment based on catchment characteristics and knowledge of rainfall | ||
| + | patterns of the catchment. | ||
| + | |||
| + | [[File:TableK1.JPG|730px|link=DCOM_Volume_I_Appendix_K]] <br> | ||
| + | |||
| + | '''K.7 Design of Earthfill Dams'''<br> | ||
| + | '''K.7.1 The Design of Earthfill dams includes the following components:'''<br> | ||
| + | (a) Embankment design (filter),<br> | ||
| + | (b) Dam height,<br> | ||
| + | (c) Foundation (Core trench),<br> | ||
| + | (d) Rip-rap adequacy,<br> | ||
| + | (e) Seepage and stability analysis,<br> | ||
| + | (f) Catchment sediment yield,<br> | ||
| + | (g) Estimation of Evapotranspiration or Evaporation from a reservoir,<br> | ||
| + | (h) Different Types of Spillways,<br> | ||
| + | (i) Freeboard estimation including wave action,<br> | ||
| + | (j) Embankment crest width,<br> | ||
| + | (k) Embankment slopes,<br> | ||
| + | (l) Design for TSF,<br> | ||
| + | (m) Dam break/failure analysis,<br> | ||
| + | (n) Design drawings.<br> | ||
| + | |||
| + | '''K.7.2 Important Data'''<br> | ||
| + | (a) The dam is intended for use mainly for domestic and livestock water demand | ||
| + | (allows for commercial and institutional demands),<br> | ||
| + | (b) Population of the area (people and livestock),<br> | ||
| + | (c) Design period of the proposed dam structure,<br> | ||
| + | (d) Catchment area in sq. km,<br> | ||
| + | (e) Ground levels along the proposed dam axis and within the reservoir,<br> | ||
| + | (f) Levels of the proposed dam at different heights.<br> | ||
| + | |||
| + | '''K.7.3 Design Assumptions'''<br> | ||
| + | (a) The dam shall be mainly for Livestock and Domestic demand as qualified | ||
| + | above,<br> | ||
| + | (b) The design period shall be for 50 years,<br> | ||
| + | (c) The water losses shall be taken as 20% of the total volume for evaporation | ||
| + | and seepage,<br> | ||
| + | (d) Embankment shall be safe against overtopping by provision of adequate | ||
| + | spillway capacity and sufficient free board as well as being stable against | ||
| + | seismic aspects,<br> | ||
| + | (e) There should be no seepage to allow free flow of water,<br> | ||
| + | (f) Water should not infiltrate through bed/cracks of embankment and hence | ||
| + | proper compaction is necessary,<br> | ||
| + | (g) The upstream and downstream slopes of the embankment should be stable | ||
| + | under all conditions. This will be taken care of through the provision of stone | ||
| + | pitching/ riprap to the upstream face to protect the embankment from wave | ||
| + | action and grass plantation on the downstream face to protect possibility of | ||
| + | soil erosion. | ||
| + | |||
| + | '''K.8 Height of the Dam'''<br> | ||
| + | Dam height refers to the embankment height taken at the lowest ground level | ||
| + | along the valley of the proposed dam axis to the embankment top level. Note | ||
| + | that the embankment top level includes also the freeboard height of the dam. | ||
| + | The height of a storage dam is governed by two factors:<br> | ||
| + | * The amount of storage that can be developed economically, and | ||
| + | * The storage volume afforded by the topography of the reservoir site. | ||
| + | The height of the dam above the bed of the stream is determined by the level to | ||
| + | which it is desired to raise the inflowing stream. This may however be restricted | ||
| + | by the limitation of funds, by the cost of land which will be under water, by | ||
| + | interference with highways railways water power development schemes, by | ||
| + | the backwater curve effect upstream of the reservoir, by the need to relocate | ||
| + | inhabitants in the reservoir area, or any other interests having prior rights on the | ||
| + | land, etc | ||
| + | |||
| + | '''Environmental conditions and their protection:''' Detailed ESIA should be | ||
| + | conducted to come up with positive and negative impacts and proposed | ||
| + | enhancement and mitigation measures, respectively. Some further literature | ||
| + | reviews should be done to confirm the validity of previous studies. Finally, field | ||
| + | collected information should also be confirmed through further web searches. | ||
| + | |||
| + | '''K.9 Design of the Embankment Filter'''<br> | ||
| + | In order to lower the phreatic surface within the embankment section, filter | ||
| + | materials are designed so as to allow safe evacuation of seepage in the dam | ||
| + | embankment section without carrying away fine construction materials. The | ||
| + | movement of seepage with fines is what is called piping. This phenomenon is | ||
| + | mitigated by designing filter materials that allow a reasonable quantity of seepage | ||
| + | to pass through the embankment wall without harming the structure. During the | ||
| + | execution of the task, the sieve analysis test results of the construction materials | ||
| + | plotted on the particle size distribution curve are used for the establishment of | ||
| + | a sound relationship between the construction materials and the filter materials | ||
| + | designed to be placed at the downstream toe of the embankment. Using the | ||
| + | same principles, the dam supervisor should establish the grading curve envelope | ||
| + | for the filter materials by using the following empirical equations. | ||
| + | |||
| + | [[File:K1011.JPG|712px|link=DCOM_Volume_I_Appendix_K]] <br> | ||
| + | [[File:K12.JPG|702px|link=DCOM_Volume_I_Appendix_K]] <br> | ||
| + | |||
| + | Whereby D50 etc. refers to the passing size etc.as determined from particle size | ||
| + | distribution analysis of the materials. Equations (10) and (11) set out piping and | ||
| + | permeability criteria, respectively; Equation (12) further defines the permeability | ||
| + | ratio. During construction of the facility the supervisor will have to find suitable | ||
| + | materials to fit the criteria established empirically in equation (10) to (12). | ||
| + | Therefore, the materials used for filter design should follow the empirically | ||
| + | established relationship. Hence, the supervisor should establish a grading curve | ||
| + | for filter materials plotted on sieve analysis result of the construction materials. | ||
| + | |||
| + | K.10 Check of the Rip-rap Adequacy for the Safety of the | ||
| + | Structure | ||
| + | The riprap size and layer depends on the side slope of the embankment and the | ||
| + | wave height calculated or estimated. During computation of the riprap sizes the | ||
| + | following guidelines are used. | ||
| + | According to the table of related values developed by Sentürk, the riprap weight | ||
| + | (D50) and the size of riprap can be extracted. During the evaluation process, values | ||
| + | of riprap size were obtained depending on the mentioned empirically developed | ||
| + | tables, whereby wave heights and embankment slope were the input parameters | ||
| + | (Sentürk, 1994, pp. 459-464). | ||
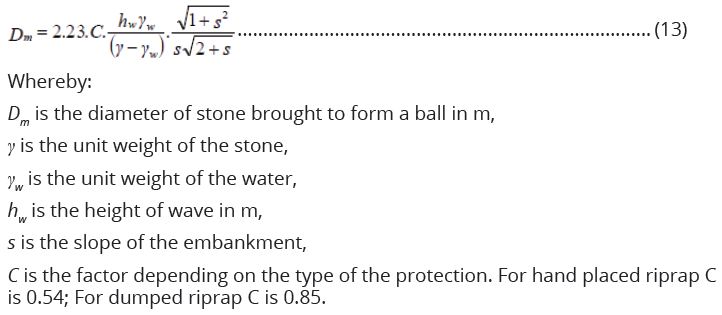
| + | According to Varshney, riprap sizes were computed by using the equation (13) | ||
| + | (Varshney at el., 1982). | ||
| + | |||
| + | [[File:K13.JPG|722px|link=DCOM_Volume_I_Appendix_K]] <br> | ||
| + | |||
| + | '''K.11 Seepage and Stability Analysis of Earthfill Dams'''<br> | ||
| + | '''K.11.1 Seepage analysis'''<br> | ||
| + | Seepage analysis is computed by using the finite element equation which | ||
| + | operates by construction of triangles whose nodes are used as collection points | ||
| + | of seepage from upstream to downstream. The following equation represents | ||
| + | the finite element equation which operates under combination of the continuity | ||
| + | equation and Darcy’s law. The combination of the continuity equation and the | ||
| + | Darcy's law gives the two dimensions Laplace finite element equation as given | ||
| + | below. | ||
| + | |||
| + | [[File:K14.JPG|704px|link=DCOM_Volume_I_Appendix_K]] <br> | ||
| + | |||
| + | Seepage analysis is computed by Geostudio software package such as Seep/W, | ||
| + | Deltares software such as Mseep and other related software. The computed | ||
| + | phreatic line from this software is exported to the stability analysis software for | ||
| + | stability analysis. | ||
| + | |||
| + | '''K.11.2 Stability Analysis'''<br> | ||
| + | During stability analysis of the embankment dams, the most important factor to | ||
| + | be taken into account is the input data analyzed during geotechnical investigations | ||
| + | and laboratory soil test and assumptions made. There are several methods used | ||
| + | to compute the stability of the embankment. | ||
| + | |||
| + | There are also many methods used for stability analysis of embankment slopes. | ||
| + | Some of the commonly used methods are the Bishop Method slice method | ||
| + | (automatic generated slip plane), Spencer method (manual constructed slip | ||
| + | plane), Fellenius (automatic generated slip plane), uplifting Van method, uplifting | ||
| + | Spencer method, Finite element method (time and data demanding method) and | ||
| + | horizontal balance method (Deltares, 2011). | ||
| + | |||
| + | Based on the existing problem and the available computation methods, Bishop is | ||
| + | a convenient model to be deployed due to the fact that the method incorporates | ||
| + | both forces and moment balance of the slices during stability computation. | ||
| + | Furthermore, the method is faster and accurate (Deltares, 2011); (USACE, 2003). | ||
| + | This method is applied with the condition of the slip plane failure method; the | ||
| + | main assumptions of the method are: | ||
| + | |||
| + | The forces between the slices are neglected in such a way that the forces are | ||
| + | assumed to be acting in the horizontal direction. The shear strength along the | ||
| + | slip plane is assumed to be constant for the entire slip circle. The equilibrium of | ||
| + | the vertical forces moments are taken into account while the horizontal forces | ||
| + | moments are neglected. | ||
| + | |||
| + | '''''Limitations'''''<br> | ||
| + | The method does not fulfil the horizontal forces equilibrium since it excludes the | ||
| + | computation of the horizontal forces' moments. If there is a great dispersion of | ||
| + | the construction materials on the structure, the method is not recommendable | ||
| + | due to its assumption of equal shear strength along the slip circle. | ||
| + | |||
| + | In spite of the limitations of the method, it is still considered to be among the | ||
| + | best in the world due to the accurate results obtained out of it. Based on the | ||
| + | professional recommendations, the method is accurate and simple to use even | ||
| + | by hand, the computations can be executed. In this manual the emphasis is given | ||
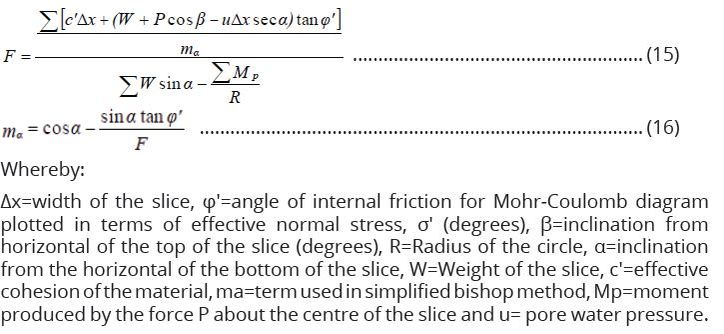
| + | to the use of the Bishop method whose equation in expressed below. | ||
| + | |||
| + | [[File:K1516.JPG|724px|link=DCOM_Volume_I_Appendix_K]] <br> | ||
| + | |||
| + | '''Scenarios used during stability analysis of earthfill dam:'''<br> | ||
| + | During computation of the stability of the embankment, the following are the | ||
| + | possible scenarios which are to be assumed and computed using the Geostudio | ||
| + | software package such as Slope/W and Deltares software such as Mstab: | ||
| + | * Earthquake at normal reservoir operation level, | ||
| + | * Earthquake under flood reservoir operation level, | ||
| + | * Safety at rapid drawdown condition of the reservoir. | ||
| + | |||
| + | '''K.12 Sediment Yield in the Catchment'''<br> | ||
| + | The estimation of sediment yield from the catchments is important for soil | ||
| + | and water conservation practices in catchments during planning, design and | ||
| + | operation of reservoir. Some few available procedures for such an exercise are | ||
| + | (Punmia et al., 2010): | ||
| + | * Flow duration curve and sediment rating curve procedure, | ||
| + | * Reservoir sedimentation surveys, | ||
| + | * Estimation of water catchment erosion and sediment delivery ratio. | ||
| + | |||
| + | Sediment yield refers to the amount of sediment exported by a basin over a period | ||
| + | of time, which is also the amount that will enter a reservoir or pond located at the | ||
| + | downstream limit of the basin (Morris and Fan, 1998). The estimates of long-term | ||
| + | sediment yield have been used for many decades to size the sediment storage | ||
| + | pool and estimate reservoir life. Sediment yield from the dam catchment is one | ||
| + | of the parameters for controlling sedimentation of small dams. The correlation | ||
| + | of sediment yields to erosion is complicated by the problem of determining the | ||
| + | sediment delivery ratio, which makes it difficult to estimate the sediment load | ||
| + | entering a reservoir/pond on the basis of erosion rate within the catchment. This | ||
| + | has to be estimated if future sedimentation rates in a dam are to be predicted. | ||
| + | In literature (Ndomba, 2011) developed sediment yield prediction equations by | ||
| + | regression analysis approach for small catchments in Tanzania in terms of climatic | ||
| + | zones of dry, moderate and wet zones. He generated equations according to the | ||
| + | specific zones in terms of the area of catchment that can be used to generate | ||
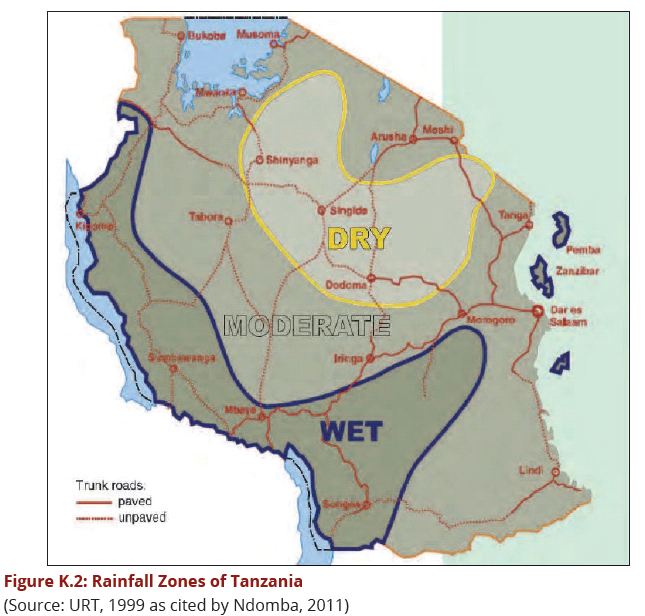
| + | estimated amounts of sediment load. The map below illustrates the sediment | ||
| + | zones as developed (Ndomba, 2011). | ||
| + | |||
| + | [[File:FigureK2.JPG|645px|link=DCOM_Volume_I_Appendix_K]] <br> | ||
| + | |||
| + | According to Ndomba (2011), three major regions were established as dry, | ||
| + | moderate and wet zones in the whole of Tanzania and equations were fitted with | ||
| + | correlations at an appropriate confidence interval. For dry and moderate climatic | ||
| + | zones the fitted equation is:<br> | ||
| + | |||
| + | SF = 556.2 A0.4313........................................................ (17)<br> | ||
| + | |||
| + | Where:<br> | ||
| + | SF= Sediment fill (m3/yr); A = Catchment area (km2, the equation for | ||
| + | sediment fill-yield was fitted in catchment areas for both dry and moderate | ||
| + | climatic zone (all regions being analyzed) satisfactorily to small catchment at 95 | ||
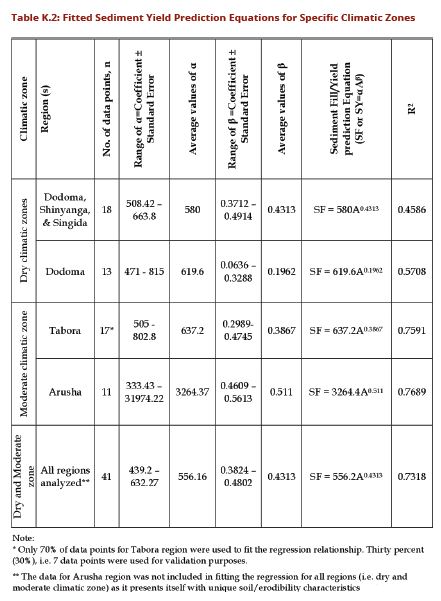
| + | % confidence interval. Table K.2 shows the detail for more fitted equations for | ||
| + | specific regions according to their climatic zones (Ndomba, 2011). | ||
| + | |||
| + | The sediment yield in a particular catchment will be used to estimate the dead | ||
| + | storage portion of the reservoir depending on the sediment transport rate per | ||
| + | annum (Sediment loading to the reservoir). | ||
| + | |||
| + | '''K.12.1 Sediment measurement and computation for sediments in water streams and rivers'''<br> | ||
| + | The total sediment load that is transported out of the catchment by a stream is | ||
| + | classified into (Subramanya, 2008): | ||
| + | * Wash load: This is composed of fine grained soils of very small fall velocity, | ||
| + | originated from land surface of the watershed and is transported into | ||
| + | streams by means of splash, sheet, rill and gully erosion. Such portion is | ||
| + | taken care of during water treatment process (coagulation and flocculation | ||
| + | process). | ||
| + | * Suspended load: Refers to relatively finer bed materials that are kept in | ||
| + | suspension in the flow through turbulence eddies and transported in | ||
| + | suspension mode by flowing water. The suspended load particles move | ||
| + | considerably long distances before settling on the bed and sides. This portion | ||
| + | of sediment forms a small part of total sediment load (usually<25%). This is | ||
| + | the commonly measured part of sediment in gauged rivers by sampling the | ||
| + | river flow. | ||
| + | * Bed load: Refers to relatively coarse bed load material that is moved at the | ||
| + | bed surface through sliding, rolling and siltation. Usually for planning and | ||
| + | design purposes, the bed load of a stream is estimated by either the use of | ||
| + | available bed load equations such as Einstein equation bed load equation or | ||
| + | is taken as a certain percent of the measured suspended load. | ||
| + | |||
| + | For planning and design purposes, the bed load of a stream is estimated by using | ||
| + | either the available bed load equations such as Einstein equation or being taken | ||
| + | as a certain percentage of measured suspended load. Usually the sediments from | ||
| + | the collected sample of sediment by filtering and its dry weight is measured. It is | ||
| + | expressed in parts per million (ppm). Suspended sediment concentration (Cs) is | ||
| + | given by: | ||
| + | |||
| + | [[File:TableK2.JPG|600px|link=DCOM_Volume_I_Appendix_K]] <br> | ||
| + | [[File:K1819.JPG|721px|link=DCOM_Volume_I_Appendix_K]] <br> | ||
| + | [[File:TableK3.JPG|728px|link=DCOM_Volume_I_Appendix_K]] <br> | ||
| + | |||
| + | '''K.12.2 Methods for Estimation of Bed Load''' | ||
| + | The popular methods for this case include the following estimation formulae: | ||
| + | |||
| + | [[File:K2021.JPG|726px|link=DCOM_Volume_I_Appendix_K]] <br> | ||
| + | |||
| + | Whereby:<br> | ||
| + | Φ = Intensity of Bed Load transport, Ψ =Flow intensity, R = Hydraulic radius, G1 | ||
| + | Bed load transport per unit width of the river, w =Specific weight of water, d = | ||
| + | diameter of grains and g =acceleration due to gravity. | ||
| + | |||
| + | '''(ii) Meyer-Peter, Muler Equation'''<br> | ||
| + | |||
| + | [[File:K22.JPG|729px|link=DCOM_Volume_I_Appendix_K]] <br> | ||
| + | |||
| + | G = Bed Load [t/day], B = Width of rivers[m], QB = Water just flowing over the bed | ||
| + | load [m3/s], D90 = Particle size of stream of bed such that 90% of the particle is | ||
| + | finer than this size, nP = Maning’s n for the river bed, Dm = Effective Bed material | ||
| + | size (weight mean diameter) in mm, d = mean diameter of water and s = Hydraulic | ||
| + | gradient | ||
| + | |||
| + | '''(iii) Du Boys Formula''' | ||
| + | Bed load transport has been based on the classical solution of Du Boys and given as: | ||
| + | |||
| + | [[File:K23.JPG|720px|link=DCOM_Volume_I_Appendix_K]] <br> | ||
| + | |||
| + | '''(iv) Laurence and Garde and Albert formula'''<br> | ||
| + | |||
| + | [[File:K24.JPG|729px|link=DCOM_Volume_I_Appendix_K]] <br> | ||
| + | |||
| + | '''Empirical estimation of Reservoir Basing on Catchment Area'''<br> | ||
| + | (i) '''Khosla’s equation:''' The annual sediment yield on volume basis is related | ||
| + | to the catchment area as below. The annual sediment yield rate (on volume | ||
| + | basis) is given by the equation: | ||
| + | |||
| + | [[File:K25.JPG|658px|link=DCOM_Volume_I_Appendix_K]] <br> | ||
| + | or Volume of sediment yield per year from a catchments: | ||
| + | [[File:K26.JPG|650px|link=DCOM_Volume_I_Appendix_K]] <br> | ||
| + | [[File:K272829.JPG|730px|link=DCOM_Volume_I_Appendix_K]] <br> | ||
| + | |||
| + | '''K.12.3 Reservoir Sediment Control'''<br> | ||
| + | Sediments in reservoirs can be reduced if the following methods in catchment | ||
| + | and reservoir site can be taken with extra care. The common methods for | ||
| + | sedimentation control include:<br> | ||
| + | (a) Proper selection of a reservoir site with less sediment inflow to the river,<br> | ||
| + | (b) Control of sediment by constructing a series of low dams upstream of the | ||
| + | reservoir,<br> | ||
| + | (c) Management of the catchment by vegetal cover to arrest the sediment to | ||
| + | flow with runoff,<br> | ||
| + | (d) Soil conservation and watershed management like strip cropping, control | ||
| + | farming, crop rotation, terracing, benching, on steep hill slopes, control and | ||
| + | management of grazing field, small embankment to prevent erosion and | ||
| + | arrest sediment,<br> | ||
| + | (e) Removal of sediment from reservoir by excavation, draining, and flushing by | ||
| + | sluices after disturbing the sediment by mechanical method,<br> | ||
| + | (f) Opening dam sluices to remove sediment coming in during flood time,<br> | ||
| + | (g) Constructing the dam in stages,<br> | ||
| + | (h) Afforestation and control of deforestation in the reservoir catchment.<br> | ||
| + | '''Note: All the above methods can be summarized into three major types as | ||
| + | mentioned below.''' | ||
| + | |||
| + | (i) '''Reduction in Sediment yield from catchments (effective catchment | ||
| + | conservation).''' This include: | ||
| + | * Environmental friendly tree planting, terracing, strip cropping, etc., | ||
| + | * Check dams to reduce sediment inflow to the stream, | ||
| + | * Vegetal cover, grassed waterways and afforestation to reduce run off | ||
| + | rates and hence reducing erosion. | ||
| + | |||
| + | (ii) '''Reduction in rate of accumulation of sediment in reservoirs. This will include | ||
| + | the following aspects:'''<br> | ||
| + | * Provision of scouring sluice at lower elevations in the dam in order to | ||
| + | flush out high concentration of sediments and density currents, | ||
| + | * Appropriate operation of gates overflow outlets and other sluices in the | ||
| + | dam. | ||
| + | |||
| + | (ii) '''Physical removal of already deposited sediments (Draging) just after | ||
| + | reservoir sedimentation survey''' (Bathmetric Survey) | ||
| + | Sedimentation against reservoir functions Subramanya, (2008) and Mohan Das | ||
| + | and Saikia (2009): | ||
| + | a) Sedimentation reduces the useful life of reservoir if not properly managed,<br> | ||
| + | b) Outlet scouring sluices may be blocked by sediments,<br> | ||
| + | c) Aggredations upstream of dam due to sediment deposition,<br> | ||
| + | d) Degradation below reservoir by outflow from scouring sluices. | ||
| + | |||
| + | '''K.13 Estimation of Evaporation or Evapotranspiration from a Reservoir'''<br> | ||
| + | Estimation of evaporation (E) or evapotranspiration (ET) is one of the essential | ||
| + | parameters in designs of reservoirs, Irrigation canals, water balance and any | ||
| + | project relating to water projects. Sometimes, only evaporation as a process of | ||
| + | water loss in vapour form due to sun radiations is enough instead of ET especially | ||
| + | when inside the reservoir there is negligible vegetation. The key factors for | ||
| + | evaporation includes solar radiation, vapour pressure, temperature, wind | ||
| + | velocity, atmospheric pressure, area of water surface, quality of water surface, | ||
| + | nature of evaporating surface, salinity of water, depth of water in the water body | ||
| + | and humidity (Mohan Das and Saikia, 2009). | ||
| + | |||
| + | '''K.13.1 Methods for Measurement or Estimation of Evaporation'''<br> | ||
| + | The cheapest method for reservoir evaporation estimation in Water Resources | ||
| + | Panning is setting reasonable percentage of live capacity of reservoir as evaporation | ||
| + | losses through long term experience or by using different hydrological studies | ||
| + | within the project area. A value of 15% of live storage capacity is adopted for | ||
| + | major water projects and 25% of live storage capacity for minor water projects. | ||
| + | Generally there are different evaporation methods which include the following | ||
| + | (Punmia et al., 2010): | ||
| + | (a) Empirical formulae,<br> | ||
| + | (b) Water budget method or storage equation,<br> | ||
| + | (c) Energy budget equation,<br> | ||
| + | (d) Mass transfer method,<br> | ||
| + | (e) Combined energy and mass transfer approach,<br> | ||
| + | (f) Pan Measurement method,<br> | ||
| + | Mohan Das and Saikia (2009). | ||
| + | |||
| + | '''K.14 Different Types of Spillways'''<br> | ||
| + | '''K.14.1 Introduction'''<br> | ||
| + | Spillways are provided for storage and detention dams to release surplus or flood | ||
| + | water which cannot be contained in the allocated storage space, and at dams | ||
| + | to bypass flows exceeding those which are turned into the diversion system. | ||
| + | Ample spillway capacity is of paramount importance for earth fill and rock fill | ||
| + | dams, which are likely to be destroyed if overtopped, whereas concreted Spillway | ||
| + | requirements are: | ||
| + | * Spillway must have capacity to spill safely the excess water from the reservoir, | ||
| + | * A spillway must be hydraulically and structurally adequate, | ||
| + | * It must be located or provided with an energy dissipating outlet structure, | ||
| + | such that spillway discharges will not cause downstream erosion or | ||
| + | undermine the toe of the dam (downstream (d/s) of the dam). | ||
| + | |||
| + | '''Design considerations:''' | ||
| + | Spillway components include: | ||
| + | * A control structure to regulate flow into the channel, | ||
| + | * A discharge channel to convey the flow released through the control device | ||
| + | to a stream below the dam, | ||
| + | * A terminal structure that enables the spillway discharge to return into the | ||
| + | stream without scouring or erosion of the toe or downstream side of the dam. | ||
| + | |||
| + | Type of spillways:<br> | ||
| + | (a) Free over-fall (straight drop),<br> | ||
| + | (b) Ogee (over flow),<br> | ||
| + | (c) Side channel,<br> | ||
| + | (d) Open channel (through a chute),<br> | ||
| + | (e) Conduit,<br> | ||
| + | (f) Tunnel,<br> | ||
| + | (g) Baffled apron drop,<br> | ||
| + | (h) Culvert and apron,<br> | ||
| + | (i) Morning glory,<br> | ||
| + | (j) Drop inlet (shelf or morning glory) [This type should not be considered except | ||
| + | on very small dams or on off-river tributaries with very small catchments]. | ||
| + | |||
| + | '''K.14.2 Spillway Types'''<br> | ||
| + | A spillway is a hydraulic structure built at a dam site for diverting the surplus | ||
| + | water from a reservoir after it has been filled to its maximum capacity. Spillways | ||
| + | are classified into different types on the basis of the arrangement of the control | ||
| + | structure, a conveyance channel and a terminal structure. Different types of | ||
| + | spillways include the following (Source: The constructor, 2020): | ||
| + | |||
| + | (a) Straight drop spillway<br> | ||
| + | (b) Ogee spillway<br> | ||
| + | (c) Shaft spillway<br> | ||
| + | (d) Chute spillway<br> | ||
| + | (e) Side channel spillway<br> | ||
| + | (f) Siphon spillway<br> | ||
| + | (g) Labyrinth spillway<br> | ||
| + | |||
| + | The selection of a certain type of spillway will depend on the following factors:<br> | ||
| + | (a) Topography of the proposed spillway site (Steep slopes call for chute | ||
| + | spillway)<br> | ||
| + | (b) Geological formation: the more stable geological formation the less erosive | ||
| + | power of the spillway, hence low operation and maintenance of the spillway<br> | ||
| + | (c) Hydraulic characteristics of the flow (subcritical flow is more preferred in | ||
| + | side channel spillways)<br> | ||
| + | (d) Availability of land for location of spillway in the constricted land, morning | ||
| + | glory and overflow spillways may be suitably applied<br> | ||
| + | (e) Hydrological condition of the catchment (the width and height of the spillway | ||
| + | depends on the magnitude of the estimated flow to be evacuated)<br> | ||
| + | |||
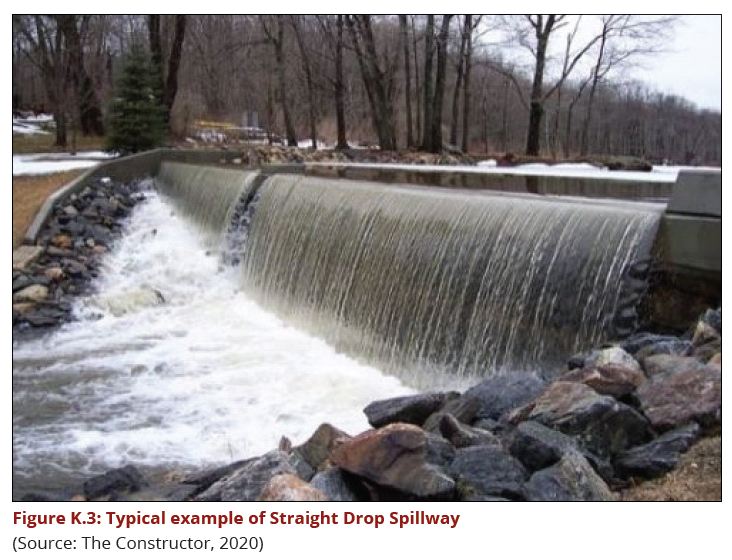
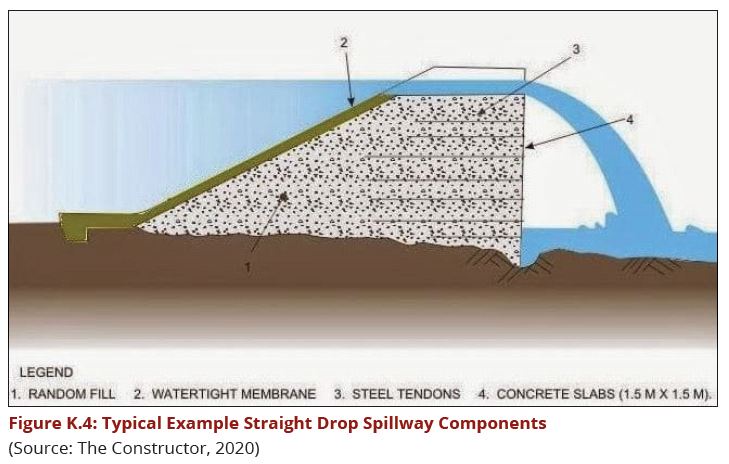
| + | '''(i) Straight Drop or free over fall Spillway'''<br> | ||
| + | A Straight drop spillway consists of low height weir wall having its downstream | ||
| + | face roughly or perfectly vertical. When the water level in the reservoir rises above | ||
| + | the normal pool level, the surplus water falls freely from the crest of the weir. | ||
| + | |||
| + | To prevent the scouring of downstream bed from falling water jet, an artificial pool | ||
| + | with a concrete apron and low secondary dam is constructed on the downstream | ||
| + | side. Proper ventilation should be provided on the underside portion of a falling | ||
| + | jet to prevent pulsating and fluctuating effects. Sometimes, an overhanging | ||
| + | projection is provided on the crest of the weir to prevent the entrance of small | ||
| + | discharges onto the face of the weir wall. Straight drop spillways are most suitable | ||
| + | for thin arch dams, earth-fill dams or bunds. | ||
| + | |||
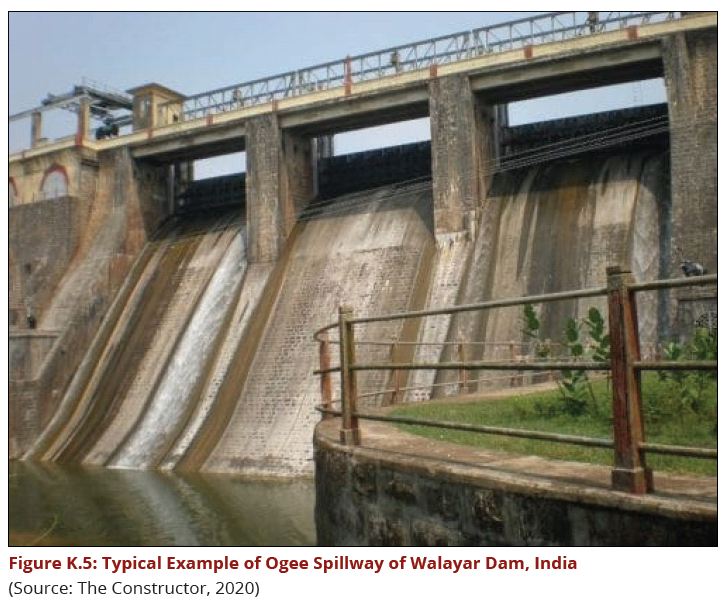
| + | '''(ii) Ogee Spillway'''<br> | ||
| + | Ogee spillway, as the name says, represents the shape of the downstream face | ||
| + | of the weir. It is an improved form of a straight drop spillway. In this case, the | ||
| + | downstream face of the weir is constructed corresponding to the shape of lower | ||
| + | nappe of freely falling water jet which is in ogee shape. The ogee shape of the | ||
| + | |||
| + | [[File:FigureK3.JPG|732px|link=DCOM_Volume_I_Appendix_K]] <br> | ||
| + | |||
| + | [[File:FigureK4.JPG|730px|link=DCOM_Volume_I_Appendix_K]] <br> | ||
| + | |||
| + | downstream face is designed on the basis of the principle of a projectile. In | ||
| + | general, the shape of lower nappe of the water jet is not constant for all water | ||
| + | heads hence, the shape obtained for the maximum head is taken into account | ||
| + | while designing ogee spillway. | ||
| + | |||
| + | [[File:FigureK5.JPG|728px|link=DCOM_Volume_I_Appendix_K]] <br> | ||
| + | |||
| + | Whenever there is surplus water, it will be freely disposed of through ogee | ||
| + | spillway along its ogee shaped crest hence it can also be called as an overflow | ||
| + | spillway. Ogee spillways are most commonly used in cases of gravity dams, arch | ||
| + | dams, buttress dams, composite dams, etc. For gravity dams, it is generally | ||
| + | located within the dam body. According to K Subramanya in 2012 it is suggested | ||
| + | that, Ogee spillway with S-shaped over flow profile is the most extensively used | ||
| + | to safely pass the flood flow out of the reservoir. | ||
| + | |||
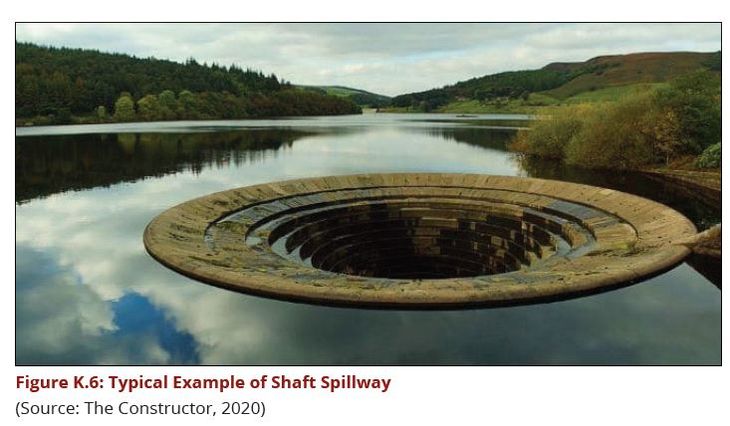
| + | '''(iii) Shaft Spillway'''<br> | ||
| + | A Shaft spillway is a type of spillway which consists of a vertical shaft followed by | ||
| + | a horizontal conduit. The surplus water enters into the vertical shaft and then to | ||
| + | the horizontal conduit and finally reaches the downstream of the channel. | ||
| + | |||
| + | [[File:FigureK6.JPG|730px|link=DCOM_Volume_I_Appendix_K]] <br> | ||
| + | |||
| + | The shaft constructed is either artificial or natural. Excavation for the natural | ||
| + | shaft is possible only when the hard rocky layer is present on the upstream | ||
| + | side. The horizontal conduit either passes through the dam body or through | ||
| + | the foundation of the dam. In the case of large projects, the inlet hole of the | ||
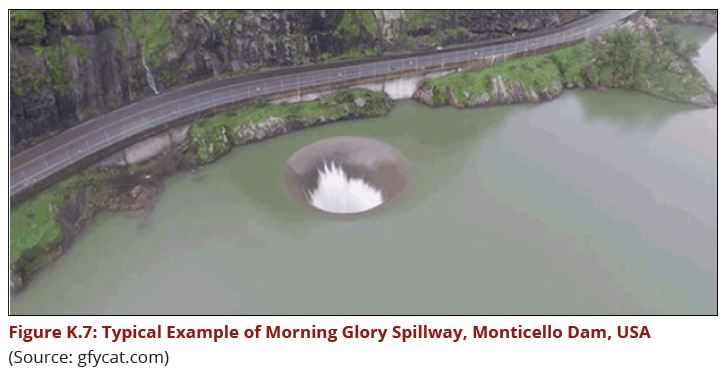
| + | vertical shaft is specially shaped which is called morning glory or glory hole of | ||
| + | the spillway. Hence, shaft spillway is also called '''Morning Glory Spillway or | ||
| + | Bell Mouth Spillway'''. Shaft spillway is recommended when there is no space to | ||
| + | provide for other types of spillways such as ogee spillway, straight drop spillway, | ||
| + | etc. | ||
| + | |||
| + | [[File:FigureK7.JPG|725px|link=DCOM_Volume_I_Appendix_K]] <br> | ||
| + | |||
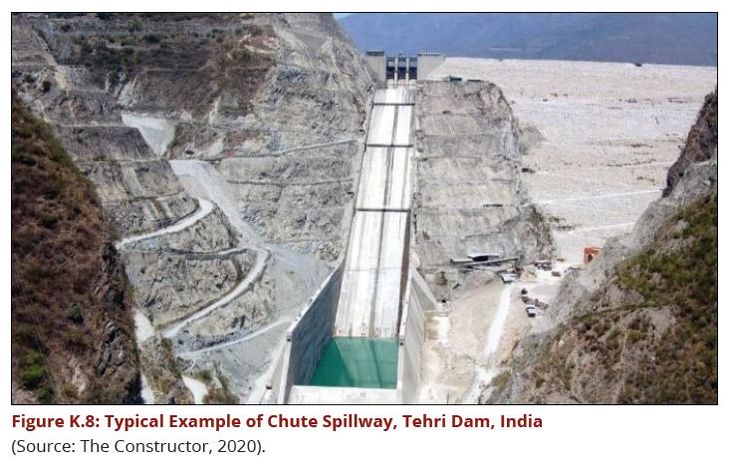
| + | '''(iv) Chute Spillway'''<br> | ||
| + | Chute spillway is a type of spillway in which surplus water from upstream | ||
| + | is disposed to the downstream through a steeply sloped open channel. It is | ||
| + | generally constructed at one end of the dam or separately away from the dam in | ||
| + | a natural saddle in a bank of the river. Chute spillway is suitable for gravity dams, | ||
| + | earthfill dams, rockfill dams, etc. But it is preferred when the width of the river | ||
| + | valley is very narrow. The water flows along the steeply sloped chute or trough | ||
| + | or open channel and reaches the downstream of the river. Chute spillway is also | ||
| + | called as trough spillway or open channel spillway. The slope of chute spillway is | ||
| + | designed in such a way that the flow should be always in supercritical condition. | ||
| + | To dissipate energy from the falling water, energy dissipaters can be provided on | ||
| + | the bed of chute spillway. | ||
| + | |||
| + | [[File:FigureK8.JPG|730px|link=DCOM_Volume_I_Appendix_K]] <br> | ||
| + | |||
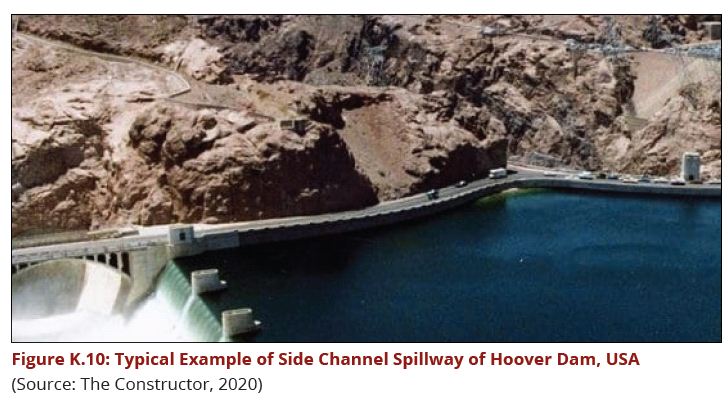
| + | '''(v) Side Channel Spillway'''<br> | ||
| + | Side channel spillway is similar to chute spillway but the only difference is the | ||
| + | crest of side channel spillway is located on one of its sides whereas crest of chute | ||
| + | spillway is located between the side walls. In other words, the water spilling from | ||
| + | the crest is turned to 90 degrees and flows parallel to the crest of side channel | ||
| + | spillway unlike in chute spillway. | ||
| + | |||
| + | [[File:FigureK9.JPG|730px|link=DCOM_Volume_I_Appendix_K]] <br> | ||
| + | |||
| + | Side channel spillways are preferred over chute spillways when flanks of sufficient | ||
| + | width are not available, usually to avoid heavy cutting. The angle of turn of water | ||
| + | flow after passing weir crest can also be kept between 00 and 90. | ||
| + | |||
| + | [[File:FigureK10.JPG|728px|link=DCOM_Volume_I_Appendix_K]] <br> | ||
| + | |||
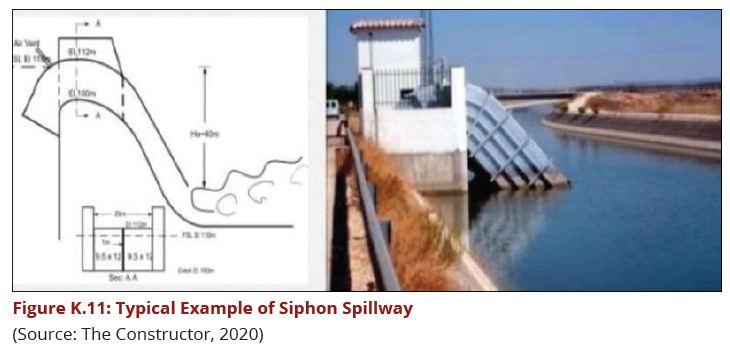
| + | '''(vi) Siphon Spillway'''<br> | ||
| + | A siphon spillway is a type of spillway in which surplus water is disposed to | ||
| + | downstream through an inverted U shaped conduit. It is generally arranged | ||
| + | inside the body or over the crest of the dam. In both types of siphon spillways, air | ||
| + | vents are provided at the bent portion of the upper passageway to prevent the | ||
| + | entrance of water when the water level is below the normal poll level. Whenever | ||
| + | the level rises above normal pool level, water enters into the conduit and is | ||
| + | discharged to the downstream of the channel by siphonic action. | ||
| + | |||
| + | [[File:FigureK11.JPG|730px|link=DCOM_Volume_I_Appendix_K]] <br> | ||
| + | |||
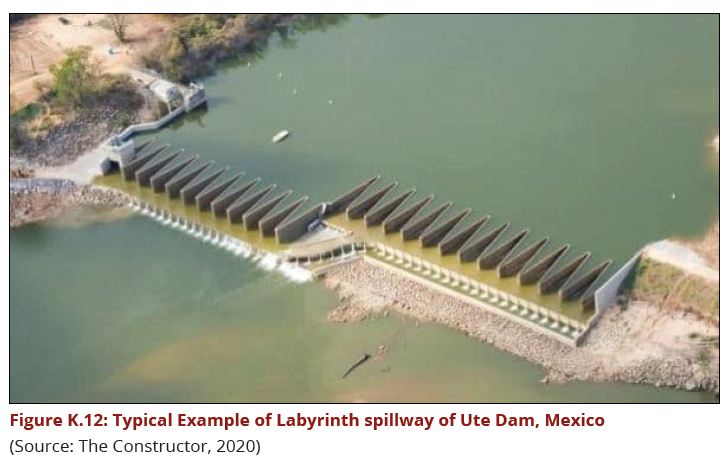
| + | '''(vii) Labyrinth Spillway'''<br> | ||
| + | A labyrinth spillway is a type of spillway in which the weir wall is constructed in | ||
| + | a zigzag manner in order to increase the effective length of the weir crest with | ||
| + | respect to the channel width. This increase in effective length raises the discharge | ||
| + | capacity of the weir and hence higher water flow at small heads can be conveyed | ||
| + | to the downstream easily. | ||
| + | |||
| + | [[File:FigureK12.JPG|727px|link=DCOM_Volume_I_Appendix_K]] <br> | ||
| + | |||
| + | '''K.14.3 Spillway Dimensioning'''<br> | ||
| + | The spillway is dimensioned after estimating the flood design which is a function | ||
| + | of peak flood or probable maximum flood estimated from the catchment that | ||
| + | contributes yield to the dam reservoir. The spillway is provided to accommodate | ||
| + | any excess water above full supply level. The governing formula depends on the | ||
| + | type of spillway decided by an Engineer as there are several types of spillway and | ||
| + | morphology. | ||
| + | |||
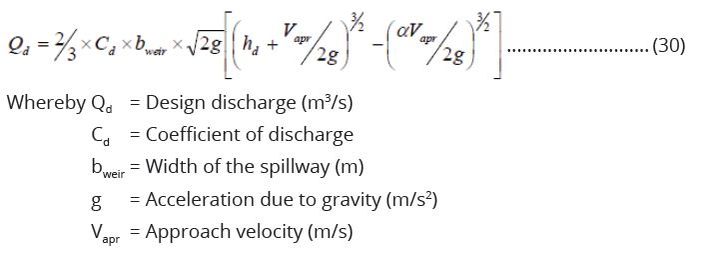
| + | The commonest type of spillways and simple to handle is over fall spillway | ||
| + | (ogee/weir type) the formula was suggested by Creager, Justin, Hinds 1945 and | ||
| + | US Bureau of Reclamation (Novack et al., 2001). This formula has to be simplified | ||
| + | to quicken the design and it is given by: | ||
| + | |||
| + | [[File:K30.JPG|707px|link=DCOM_Volume_I_Appendix_K]] <br> | ||
| + | |||
| + | From above the following equation the following are always assumed: | ||
| + | * Approach velocity (Vapr) is very small ≈ 0; the velocity that water passes over | ||
| + | the crest weir after heating the crest structure. | ||
| + | * Pressure on the spillway is greater than atmospheric | ||
| + | * Coefficient of discharge of discharge is in the range 0.578 < Cd < 0.745; Cd is | ||
| + | assumed to be 0.62 | ||
| + | |||
| + | The formula is reduced and simplified to: | ||
| + | |||
| + | [[File:K31.JPG|691px|link=DCOM_Volume_I_Appendix_K]] <br> | ||
| + | |||
| + | By using trial and error or excel program the value of weir can be computed by | ||
| + | trying different values of hd. Different values of hd at different trials give different | ||
| + | values of bweir and hence a need for an accurate judgment for an appropriate | ||
| + | value to be used with respect to site conditions. The shape of the profile of the | ||
| + | crest downstream of the apex can be expressed by using the equation: | ||
| + | |||
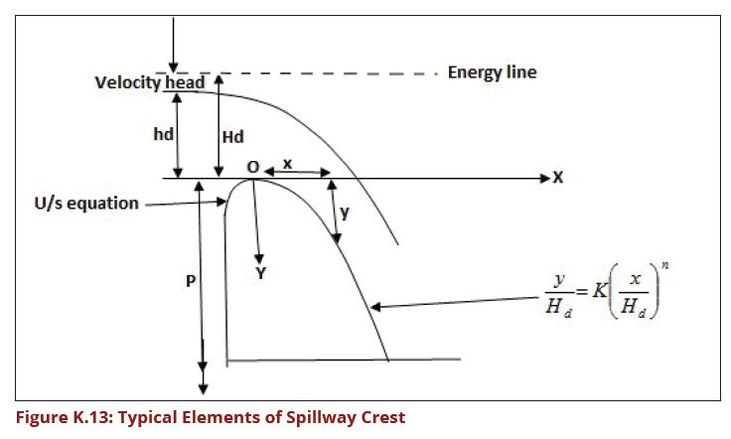
| + | [[File:K32.JPG|693px|link=DCOM_Volume_I_Appendix_K]] <br> | ||
| + | |||
| + | where K and n are constants and their values depend upon the inclination of the | ||
| + | upstream face and depend also on the velocity of approach. Typical values for K | ||
| + | and n are given in Table K.4 | ||
| + | |||
| + | [[File:TableK4.JPG|721px|link=DCOM_Volume_I_Appendix_K]] <br> | ||
| + | |||
| + | [[File:FigureK13.JPG|731px|link=DCOM_Volume_I_Appendix_K]] <br> | ||
| + | |||
| + | Where: X = Coordinate, Y = Coordinate, O = Original of coordinates and apex of | ||
| + | crest, Hd = Design energy head, P = Pressure zone | ||
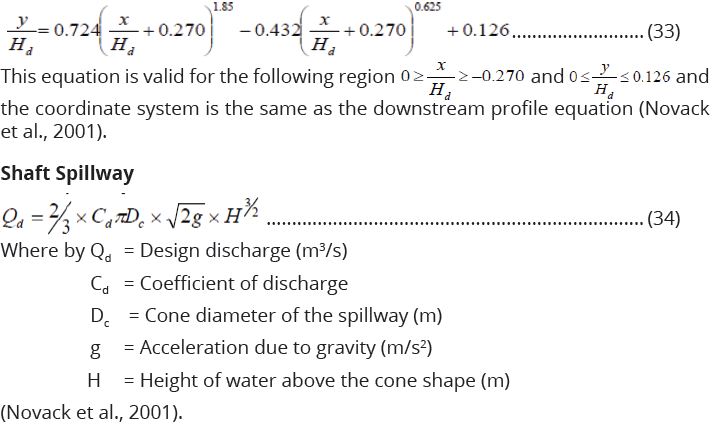
| + | The crest profile upstream of the apex is usually given by a series of compound | ||
| + | curves. Cassidy reported that, the equation for the upstream portion of a vertical | ||
| + | faced spillway as here below | ||
| + | |||
| + | [[File:K3334.JPG|717px|link=DCOM_Volume_I_Appendix_K]] <br> | ||
| + | |||
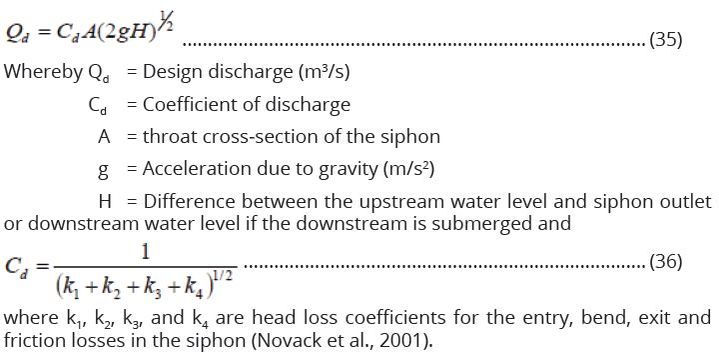
| + | '''Siphon Spillway'''<br> | ||
| + | This kind of spillway at very low flows operates as a weir; as the flow increases | ||
| + | the upstream water level rises, the velocity in the siphon increases, and the flow | ||
| + | in the lower leg begins to exhaust air from the top of the siphon until this primes | ||
| + | and begins to flow full as a pipe with a discharge given by: | ||
| + | |||
| + | [[File:K3536.JPG|719px|link=DCOM_Volume_I_Appendix_K]] <br> | ||
| + | |||
| + | '''K.15 Freeboard (Fb) Estimation'''<br> | ||
| + | This is a very important parameter in dam designing Engineering. It is the vertical | ||
| + | distance between the top of the dam and the full supply level in the reservoir. The | ||
| + | top of the dam is the highest water tight level of the structure and could thus be | ||
| + | the top of the water tight parapet. The free board has the following components: | ||
| + | (a) Rise in reservoir level due to flood routing(flood surcharge),<br> | ||
| + | (b) Seiche effects,<br> | ||
| + | (c) Wind set up of the water surface, and<br> | ||
| + | (d) Wave action and run-up of waves on the dam.<br> | ||
| + | |||
| + | Components ii, iii and iv are considered to be the key aspects in free board | ||
| + | estimation and they are all sometimes termed as wave free board. Another | ||
| + | component may be considered to account for effects of shore instabilities (rock | ||
| + | fall, landslides etc). In embankment dams, the total free board must also include | ||
| + | embankment and foundation (core trench) settlements as every material has its | ||
| + | allowable settlement. | ||
| + | |||
| + | In estimating of free board the following are important: | ||
| + | * General engineering judgments depending on the prevailing situation of the site, | ||
| + | * Hydrological analysis(statistical analysis), | ||
| + | * Damage that would result from the overtopping of the dam. | ||
| + | |||
| + | Previous Page: [[DCOM_Volume_I_Appendix_J]] << >> Next Page: [[DCOM_Volume_I_Appendix_L]] | ||
Latest revision as of 16:51, 20 July 2022
APPENDIX K: DESIGN OF DAMS FOR WATER SOURCES
K.1 Introduction
In this Appendix, the following condensed information has been provided in order to assist design engineers to design dams that are expected to provide water for domestic use, to support livestock as well as for commercial and some industrial use. However, it should be borne in mind that the major water demand will be for domestic and livestock use. Furthermore, in Tanzania, majority of the existing dams for water sources are earthfill dams and only a few are rockfill dams. Furthermore, where a water source comes from a concrete dam, the primary purpose of that dam was for hydropower generation and hence the dam design is undertaken by the respective power generation agency. The Appendix has been broken into 20 sections that include:
- Types of Dams,
- Dam and Reservoir Pre-Surveys and Detailed Studies,
- Reconnaissance of Potential Dam Sites,
- Empirical Methods for Capacity Evaluation of Dam Construction Sites,
- Preliminary Data Collection (Pre-design),
- Designs of Earth-fill Dams,
- Height of the Dam,
- Design of the Embankment Filter
- Check of the Rip-rap Adequacy for the Safety of the Structure,
- Seepage and Stability Analysis of the Earth-fill Dams,
- Sediment Yield in the Catchment,
- Estimation of Evaporation from the Reservoir,
- Different Types of Spillways,
- Freeboard (Fb) Estimation,
- Estimation of Freeboard due to wave action (fwave),
- Embankment Crest Width (W),
- Embankment Slopes,
- Design Requirements for Tailings Storage Facility (TSF)
- Dam Break/Failure Analysis,
- Design Drawings.
K.2 Types of Dams
The general choice of a dam will depend to a large extent on the site selected for it. There are mainly three general types of dams that include:
- Earthfill dams which also includes rockfill dams;
- Concrete and Masonry dams;
- Sub-surface dams.
In the case of earthfill dams, the pressure exerted by their weight spreads over a much greater area by virtue of having flatter embankment slopes. A rockfill dam consists of an embankment made of stones of irregular sizes and shape faced either with concrete or masonry earth and clay. Concrete dams require foundations of much greater bearing pressure (strength) than earthfill dams which can be more easily constructed. A slight settlement in the foundation of a concrete or masonry dam may give rise to fractures whereas the same can often be well accommodated in the earth-fill dams. Technically, concrete dams are rigid structures while earthfill and rockfill dams are deformable structures. Because concrete dams are not common in water supply projects in Tanzania, no further discussion of these type of dams is presented in the manual.
Sub-surface dams are usually constructed by excavating a trench within the sand-bed of a river during the dry season which is then filled with impervious material that may or may not be zoned. Further design specifications of dams for water sources focus on earthfill dams. Rock-fill and earth-fill dams are usually built in relatively broad valley sites because large-sized machines can be operated efficiently in such sites. The selection of the dam type should be carefully made, firstly basing this on materials procurable at the dam site or in the neighbourhood, and secondly in case of fill type and where this can be found. Rain and temperature greatly affects the work period available.
A flood spillway is an indispensable part of any dam structure and therefore its size, type and the natural conditions involved in its layout often proves to be a governing factor in the selection of dam type. Because of the cost of spillways and the high sediment load in main watercourses, designers should always look at the possibility of off-channel storage sites on tributaries as these can often prove to be the more cost effective alternative, even though they often involve pumped storage.
K.3 Dam and Reservoir Pre-Surveys and Detailed Studies
Pre-surveys are required to be undertaken for each of the factors listed below. Subsequent to the pre-surveys, detailed studies have to be conducted on each of the following aspects:
a) Precipitation and reservoir evaporation
b) Inflow of sediments from main and any of the tributary rivers
c) Planned highest water levels
d) Watershed surroundings
e) Water quality
f) Topographical data
g) Geology of the area
h) Foundation characteristics
i) Preliminary location and hydraulic analysis of the spillways
j) Water demand and use conditions
k) Choice of the most suitable dam site.
K.4 Reconnaissance of Potential Dam Sites
A suitable site for a good reservoir shall depend upon the following factors:
a) Geological condition of the catchment area should be such that percolation losses are minimum and favors only maximum runoff.
b) The reservoir site should be such that quantity of leakage through it should be minimum. Reservoir sites having highly permeable rocks reduce water tightness of the reservoir. Good types of rocks that may not allow passage of much water includes shale, slates, schist, gneiss's, and crystalline igneous rocks such as granite.
c) The dam should be founded on sound, water tight rock base, and percolation below the dam should be minimum. The cost of the dam is often a controlling factor in selection of the dam site.
d) The reservoir basin should have a narrow opening in the valley so that the length of the dam is less.
e) The cost of real estate for reservoir including road, rail road, dwelling relocation, etc must be as little as possible.
f) The topography of the reservoir site should be such that it has adequate capacity without submerging excessive land and other properties.
g) The site should be such that a deep reservoir is formed. A deep reservoir is preferable to a shallow one because of:
- Lower cost of land submerged per unit of capacity,
- Less evaporation losses because of reduction in the water spread area,
- Less likely hood of weed growth.
h) The reservoir site should be such that it avoids or excludes water from those tributaries which carry a high percentage of silt in water.
i) The reservoir site should be such that the water stored in it is suitable for the purpose for which the project is undertaken. The soil and rock mass at the reservoir site must not contain any objectionable soluble minerals and salts (Punmia et al., 2010).
K.5 Empirical Methods for Capacity Evaluation of Dam Construction Sites
The cross sections of the proposed dam sites are usually plotted after acquisition of data from the field by using horizontal interval and the elevations taken by GPS during reconnaissance. The plotted cross sections will show that, there is a potentiality of building a dam of a certain type and at different heights and embankment lengths. The proposed dam sites may face different challenges including a small catchment area and hence poor water yield that can fill the dam, catchment degradation due to different human activities and hence sediment transport challenges along the river valleys. etc. All these challenges have to be well addressed during design. Usually the proposed dam sites have to be refined during detailed design phase as they may be shifted on either side downstream or upstream for appropriate dam axis setting with respect to appropriate dam heights and their capacities.
Through site verification, a number of potential dam sites can be identified and verified with their initial capacities being empirically computed. Three empirical methods may be used to make rough estimation of the reservoir capacities and these are illustrated as methods 1, 2 and 3 as described in the next paragraphs. The appropriate dam capacities will further be appropriately determined by using contours during the detailed survey stage of undertaking the project. Materials for construction (sand, gravel and stones) of such water storage facility are to be investigated and if possible to be cheaply and locally available within the project sites with clearly noted distance from the respective sites in-line with the specifications as presented in Chapter Twelve of the Volume I of the DCOM Manual.
K.5.1 Method No.1: Queensland Water Resources Commission
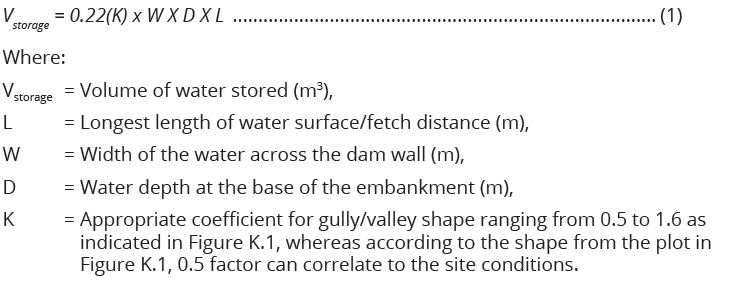
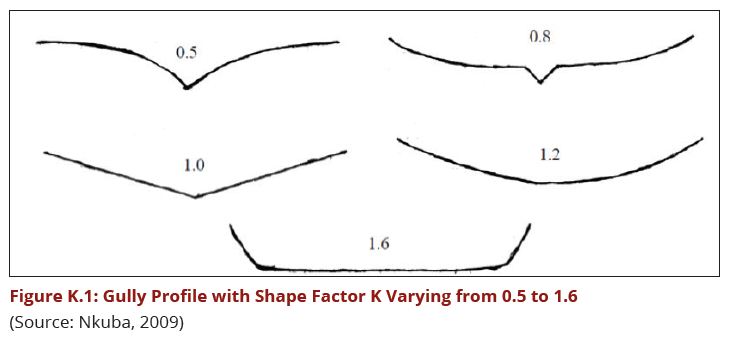
Capacity for each dam site is estimated basing on appropriate empirical formula to get initial guess of the expected potential storage volume for each dam. The reservoir capacity is worked out based on empirical formula estimation as per the Queensland Water Resources Commission method (cited by Nkuba, 2009). The Commission developed a method which involves determining the shape of the gully/valley slice across section and then selecting a corresponding shape from a list each of which has its own co-efficient between 0.5 and 1.6 as illustrated in Figure K.1.
K.5.2 Method No.2: Best Practice from FAO Experience
Reservoir storage capacity can alternatively be estimated basing on field
experience of FAO as follows (FAO, 2010):
6 is a factor (generally conservative) that can be adjusted (to 5 or 4) with experience and local knowledge. All the parameters in method 2 can be determined by the use of a level or theodolite (or any accurate GPS equipment) at the site. The capacity estimated in this way is accurate to within about 20 percent, but it must be revised by a more detailed survey when the site has been approved for possible construction. The formula considers the water volume to be an inverted pyramid with a triangular surface area (LT/2) and H/3 for the height/ depth, and is a simplification of reality. With experience, one is able to judge fairly accurately how an individual valley will compare with such an idealized picture and therefore, to adjust the resulting conclusions (FAO, 2010).
K.5.3 Method No.3: Nelson Equation
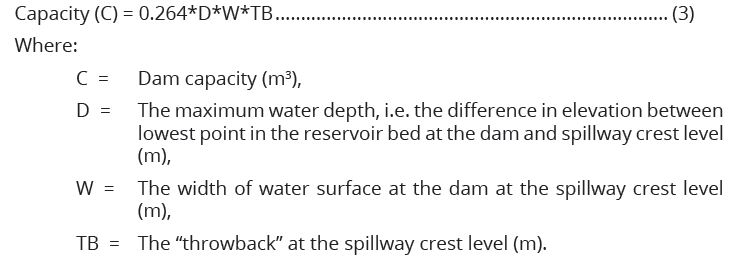
Nelson (1991) equation as cited by Nkuba (2009) is one of the recommended
equations for quick dam capacity estimations.
K.6 Preliminary Data Collection (Pre-design)
K.6.1 Geotechnical Investigations
In all major Civil Engineering projects, geotechnical investigations are important
in guiding designers on the most essential items to be considered. This important
item may only take 0.25 - 1% of the whole cost of the project. Such investigation
is required to give detailed information on the following aspects (Punmia et al.,
2010):
(a) Water tightness of the reservoir Basin,
(b) Suitability of the foundation for the Dam,
(c) Geotechnical and structural features including; folds, faults, fissures,
lineaments etc., of the underlying rock at the site,
(d) Type and depth of overburden (superficial deposit),
(e) Location of permeable and soluble rocks, if any,
(f) Ground water conditions in the region,
(g) Location of quarry sites and other sources for materials to be used for dam
construction and the estimated quantities of the intended materials,
(h) Study of the geology for the catchment area as it has effects on the runoff
and percolations,
(i) The geology of the dam site is important from the point of view that it secures
the foundation for the dam,
(j) There should be special requirements for the geology of the reservoir site
such that there is no danger of serious leakage when the ground is under
pressure from the full head of water in the reservoir,
(k) The nature of the sub surface geology should be explored by trial bores or
various means of geological explorations.
K.6.2 Catchment Yield
The total quantity of surface water that can be expected in a given period from a
stream at the outlet of its catchment is known as the "yield" of the catchment in
that period. In determining the catchment potential in yield to the dam reservoir,
some basic factors are usually considered. Such factors include catchment area,
catchment characteristics and the designed maximum flood expected to pass
through the spillway during extreme events.
K.6.3 Topographical Surveys
This stage is executed when the site is suitable for dam construction and already
being confirmed against its potential to store enough water. Topographical
surveys will include contours generation after taking the ground levels as
per directed intervals by the Engineer. It is important to take the levels at the
reservoir area and locations of the spillway, other related infrastructure with the
dam, appropriate contours, and spatial arrangement of facilities with readable
scale. Propose survey control points for horizontal and vertical movements of the
embankment, baseline information, propose spacing and bench marks usually
away from the Tailings Storage Facility (TSF) embankment. Some of the relevant
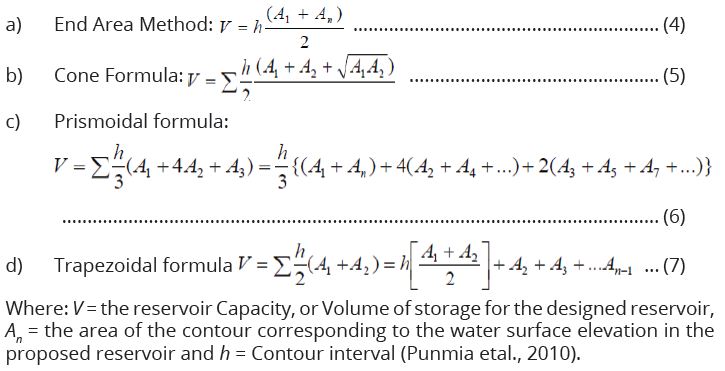
and popular equations which may be used for volume computation include using
areas covered by the contours and those include the following:
K.6.4 Catchment Area
Catchment area estimation is nowadays done by digitizing the map of the project
area, using GIS computer based tool (Arcview, ArcGIS, etc.). The total catchment
area for each dam site catchment is normally computed in sq. km-unit.
K.6.5 Flood Estimation for Dam Design
Some of the existing popular methods used for flood estimation include the
following:
(a) Envelope curves,
(b) Empirical formulae,
(c) Physical indication of past floods,
(d) Rational method,
(e) Probable Maximum Precipitation (PMP) chart,
(f) Rating curves or rating equations,
(g) Unit hydrograph method,
(h) Flood frequency analysis,
(i) Frequency distribution functions.
Out of all these methods, the five (5) commonly used ones include empirical
formula, rational method, unit hydrograph method, Flood frequency analysis
and Frequency Distribution Functions. However flood frequency analysis and
frequency distribution functions methods based on probability and statistics
are the most favourable and these give quite reliable flood values compared
to the rest of the methods. Frequency Distribution Functions for extreme flood
prediction values include the following:
- Gumbel’s extreme value distribution,
- Log Peason Type III distribution,
- Log normal distribution.
These have been further discussed in Chapter Three of Volume I of the DCOM Manual.
K.6.6 Estimation of Discharge for Charco and Small Dams
(a) Mean Annual Runoff
The Mean Annual Runoff (MAR) can be estimated from a dam catchment
conventionally by being expressed as an equivalency of runoff depth, in mm. The
simplest method of estimating mean annual runoff is to apply a runoff coefficient
to the mean annual runoff as illustrated below.
MAR=ROC*MAP................................................................ (8)
Where:
MAR = Mean annual runoff
MAP = Mean annual precipitation (mm)
ROC = Runoff coefficient
This approach is used in many of the simpler small dam design manuals, where for semi-arid areas the runoff coefficient is often set at 0.1. Runoff depends on many parameters in addition to rainfall and this is recognized in some procedures, which adjust the runoff coefficient to account for land forms, soil type and drainage, and cover etc. This approach requires a considerable quantity of catchment specific data that will be not readily available to most small dam designers (Nkuba, 2009).
(b) Mean Annual Flood Peak Discharge
A spillway must be designed to pass the design flood without damage, and the
peak flood without the dam overtopping, i.e. the peak flood must be contained
within the dry freeboard. The design has to be checked by ensuring that the 250
year return flood can be passed without the dam overtopping i.e. without the
additional head needed exceeding the dry freeboard. Using regional frequency
method, the mean annual peak flood (MAF) is estimated as follows (Nkuba, 2009):
(c) Specific Yield of the Catchment
The majority of earth dam failures (around 90%) in the world are due to underdesigned
spillway or under estimated floods which cause overtopping of the
embankment followed by erosion of the downstream slope and finally the
breaching of the embankment. Consequently, obtaining accurate figures for
the flood expectations is the most important part of the design from the safety
point of view. Figures in Table K.1 are for Q100 or 100 year return period from
flood studies in Kenya as cited by Nkuba (2009). These should be used with great
personal judgment based on catchment characteristics and knowledge of rainfall
patterns of the catchment.
K.7 Design of Earthfill Dams
K.7.1 The Design of Earthfill dams includes the following components:
(a) Embankment design (filter),
(b) Dam height,
(c) Foundation (Core trench),
(d) Rip-rap adequacy,
(e) Seepage and stability analysis,
(f) Catchment sediment yield,
(g) Estimation of Evapotranspiration or Evaporation from a reservoir,
(h) Different Types of Spillways,
(i) Freeboard estimation including wave action,
(j) Embankment crest width,
(k) Embankment slopes,
(l) Design for TSF,
(m) Dam break/failure analysis,
(n) Design drawings.
K.7.2 Important Data
(a) The dam is intended for use mainly for domestic and livestock water demand
(allows for commercial and institutional demands),
(b) Population of the area (people and livestock),
(c) Design period of the proposed dam structure,
(d) Catchment area in sq. km,
(e) Ground levels along the proposed dam axis and within the reservoir,
(f) Levels of the proposed dam at different heights.
K.7.3 Design Assumptions
(a) The dam shall be mainly for Livestock and Domestic demand as qualified
above,
(b) The design period shall be for 50 years,
(c) The water losses shall be taken as 20% of the total volume for evaporation
and seepage,
(d) Embankment shall be safe against overtopping by provision of adequate
spillway capacity and sufficient free board as well as being stable against
seismic aspects,
(e) There should be no seepage to allow free flow of water,
(f) Water should not infiltrate through bed/cracks of embankment and hence
proper compaction is necessary,
(g) The upstream and downstream slopes of the embankment should be stable
under all conditions. This will be taken care of through the provision of stone
pitching/ riprap to the upstream face to protect the embankment from wave
action and grass plantation on the downstream face to protect possibility of
soil erosion.
K.8 Height of the Dam
Dam height refers to the embankment height taken at the lowest ground level
along the valley of the proposed dam axis to the embankment top level. Note
that the embankment top level includes also the freeboard height of the dam.
The height of a storage dam is governed by two factors:
- The amount of storage that can be developed economically, and
- The storage volume afforded by the topography of the reservoir site.
The height of the dam above the bed of the stream is determined by the level to which it is desired to raise the inflowing stream. This may however be restricted by the limitation of funds, by the cost of land which will be under water, by interference with highways railways water power development schemes, by the backwater curve effect upstream of the reservoir, by the need to relocate inhabitants in the reservoir area, or any other interests having prior rights on the land, etc
Environmental conditions and their protection: Detailed ESIA should be conducted to come up with positive and negative impacts and proposed enhancement and mitigation measures, respectively. Some further literature reviews should be done to confirm the validity of previous studies. Finally, field collected information should also be confirmed through further web searches.
K.9 Design of the Embankment Filter
In order to lower the phreatic surface within the embankment section, filter
materials are designed so as to allow safe evacuation of seepage in the dam
embankment section without carrying away fine construction materials. The
movement of seepage with fines is what is called piping. This phenomenon is
mitigated by designing filter materials that allow a reasonable quantity of seepage
to pass through the embankment wall without harming the structure. During the
execution of the task, the sieve analysis test results of the construction materials
plotted on the particle size distribution curve are used for the establishment of
a sound relationship between the construction materials and the filter materials
designed to be placed at the downstream toe of the embankment. Using the
same principles, the dam supervisor should establish the grading curve envelope
for the filter materials by using the following empirical equations.
Whereby D50 etc. refers to the passing size etc.as determined from particle size distribution analysis of the materials. Equations (10) and (11) set out piping and permeability criteria, respectively; Equation (12) further defines the permeability ratio. During construction of the facility the supervisor will have to find suitable materials to fit the criteria established empirically in equation (10) to (12). Therefore, the materials used for filter design should follow the empirically established relationship. Hence, the supervisor should establish a grading curve for filter materials plotted on sieve analysis result of the construction materials.
K.10 Check of the Rip-rap Adequacy for the Safety of the Structure The riprap size and layer depends on the side slope of the embankment and the wave height calculated or estimated. During computation of the riprap sizes the following guidelines are used. According to the table of related values developed by Sentürk, the riprap weight (D50) and the size of riprap can be extracted. During the evaluation process, values of riprap size were obtained depending on the mentioned empirically developed tables, whereby wave heights and embankment slope were the input parameters (Sentürk, 1994, pp. 459-464). According to Varshney, riprap sizes were computed by using the equation (13) (Varshney at el., 1982).
K.11 Seepage and Stability Analysis of Earthfill Dams
K.11.1 Seepage analysis
Seepage analysis is computed by using the finite element equation which
operates by construction of triangles whose nodes are used as collection points
of seepage from upstream to downstream. The following equation represents
the finite element equation which operates under combination of the continuity
equation and Darcy’s law. The combination of the continuity equation and the
Darcy's law gives the two dimensions Laplace finite element equation as given
below.
Seepage analysis is computed by Geostudio software package such as Seep/W, Deltares software such as Mseep and other related software. The computed phreatic line from this software is exported to the stability analysis software for stability analysis.
K.11.2 Stability Analysis
During stability analysis of the embankment dams, the most important factor to
be taken into account is the input data analyzed during geotechnical investigations
and laboratory soil test and assumptions made. There are several methods used
to compute the stability of the embankment.
There are also many methods used for stability analysis of embankment slopes. Some of the commonly used methods are the Bishop Method slice method (automatic generated slip plane), Spencer method (manual constructed slip plane), Fellenius (automatic generated slip plane), uplifting Van method, uplifting Spencer method, Finite element method (time and data demanding method) and horizontal balance method (Deltares, 2011).
Based on the existing problem and the available computation methods, Bishop is a convenient model to be deployed due to the fact that the method incorporates both forces and moment balance of the slices during stability computation. Furthermore, the method is faster and accurate (Deltares, 2011); (USACE, 2003). This method is applied with the condition of the slip plane failure method; the main assumptions of the method are:
The forces between the slices are neglected in such a way that the forces are assumed to be acting in the horizontal direction. The shear strength along the slip plane is assumed to be constant for the entire slip circle. The equilibrium of the vertical forces moments are taken into account while the horizontal forces moments are neglected.
Limitations
The method does not fulfil the horizontal forces equilibrium since it excludes the
computation of the horizontal forces' moments. If there is a great dispersion of
the construction materials on the structure, the method is not recommendable
due to its assumption of equal shear strength along the slip circle.
In spite of the limitations of the method, it is still considered to be among the best in the world due to the accurate results obtained out of it. Based on the professional recommendations, the method is accurate and simple to use even by hand, the computations can be executed. In this manual the emphasis is given to the use of the Bishop method whose equation in expressed below.
Scenarios used during stability analysis of earthfill dam:
During computation of the stability of the embankment, the following are the
possible scenarios which are to be assumed and computed using the Geostudio
software package such as Slope/W and Deltares software such as Mstab:
- Earthquake at normal reservoir operation level,
- Earthquake under flood reservoir operation level,
- Safety at rapid drawdown condition of the reservoir.
K.12 Sediment Yield in the Catchment
The estimation of sediment yield from the catchments is important for soil
and water conservation practices in catchments during planning, design and
operation of reservoir. Some few available procedures for such an exercise are
(Punmia et al., 2010):
- Flow duration curve and sediment rating curve procedure,
- Reservoir sedimentation surveys,
- Estimation of water catchment erosion and sediment delivery ratio.
Sediment yield refers to the amount of sediment exported by a basin over a period of time, which is also the amount that will enter a reservoir or pond located at the downstream limit of the basin (Morris and Fan, 1998). The estimates of long-term sediment yield have been used for many decades to size the sediment storage pool and estimate reservoir life. Sediment yield from the dam catchment is one of the parameters for controlling sedimentation of small dams. The correlation of sediment yields to erosion is complicated by the problem of determining the sediment delivery ratio, which makes it difficult to estimate the sediment load entering a reservoir/pond on the basis of erosion rate within the catchment. This has to be estimated if future sedimentation rates in a dam are to be predicted. In literature (Ndomba, 2011) developed sediment yield prediction equations by regression analysis approach for small catchments in Tanzania in terms of climatic zones of dry, moderate and wet zones. He generated equations according to the specific zones in terms of the area of catchment that can be used to generate estimated amounts of sediment load. The map below illustrates the sediment zones as developed (Ndomba, 2011).
According to Ndomba (2011), three major regions were established as dry,
moderate and wet zones in the whole of Tanzania and equations were fitted with
correlations at an appropriate confidence interval. For dry and moderate climatic
zones the fitted equation is:
SF = 556.2 A0.4313........................................................ (17)
Where:
SF= Sediment fill (m3/yr); A = Catchment area (km2, the equation for
sediment fill-yield was fitted in catchment areas for both dry and moderate
climatic zone (all regions being analyzed) satisfactorily to small catchment at 95
% confidence interval. Table K.2 shows the detail for more fitted equations for
specific regions according to their climatic zones (Ndomba, 2011).
The sediment yield in a particular catchment will be used to estimate the dead storage portion of the reservoir depending on the sediment transport rate per annum (Sediment loading to the reservoir).
K.12.1 Sediment measurement and computation for sediments in water streams and rivers
The total sediment load that is transported out of the catchment by a stream is
classified into (Subramanya, 2008):
- Wash load: This is composed of fine grained soils of very small fall velocity,
originated from land surface of the watershed and is transported into streams by means of splash, sheet, rill and gully erosion. Such portion is taken care of during water treatment process (coagulation and flocculation process).
- Suspended load: Refers to relatively finer bed materials that are kept in
suspension in the flow through turbulence eddies and transported in suspension mode by flowing water. The suspended load particles move considerably long distances before settling on the bed and sides. This portion of sediment forms a small part of total sediment load (usually<25%). This is the commonly measured part of sediment in gauged rivers by sampling the river flow.
- Bed load: Refers to relatively coarse bed load material that is moved at the
bed surface through sliding, rolling and siltation. Usually for planning and design purposes, the bed load of a stream is estimated by either the use of available bed load equations such as Einstein equation bed load equation or is taken as a certain percent of the measured suspended load.
For planning and design purposes, the bed load of a stream is estimated by using either the available bed load equations such as Einstein equation or being taken as a certain percentage of measured suspended load. Usually the sediments from the collected sample of sediment by filtering and its dry weight is measured. It is expressed in parts per million (ppm). Suspended sediment concentration (Cs) is given by:
K.12.2 Methods for Estimation of Bed Load The popular methods for this case include the following estimation formulae:
Whereby:
Φ = Intensity of Bed Load transport, Ψ =Flow intensity, R = Hydraulic radius, G1
Bed load transport per unit width of the river, w =Specific weight of water, d =
diameter of grains and g =acceleration due to gravity.
(ii) Meyer-Peter, Muler Equation
G = Bed Load [t/day], B = Width of rivers[m], QB = Water just flowing over the bed load [m3/s], D90 = Particle size of stream of bed such that 90% of the particle is finer than this size, nP = Maning’s n for the river bed, Dm = Effective Bed material size (weight mean diameter) in mm, d = mean diameter of water and s = Hydraulic gradient
(iii) Du Boys Formula Bed load transport has been based on the classical solution of Du Boys and given as:
(iv) Laurence and Garde and Albert formula
Empirical estimation of Reservoir Basing on Catchment Area
(i) Khosla’s equation: The annual sediment yield on volume basis is related
to the catchment area as below. The annual sediment yield rate (on volume
basis) is given by the equation:

or Volume of sediment yield per year from a catchments:

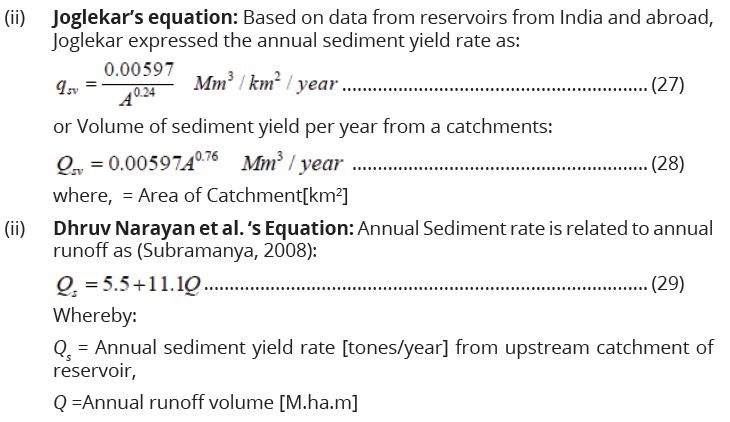
K.12.3 Reservoir Sediment Control
Sediments in reservoirs can be reduced if the following methods in catchment
and reservoir site can be taken with extra care. The common methods for
sedimentation control include:
(a) Proper selection of a reservoir site with less sediment inflow to the river,
(b) Control of sediment by constructing a series of low dams upstream of the
reservoir,
(c) Management of the catchment by vegetal cover to arrest the sediment to
flow with runoff,
(d) Soil conservation and watershed management like strip cropping, control
farming, crop rotation, terracing, benching, on steep hill slopes, control and
management of grazing field, small embankment to prevent erosion and
arrest sediment,
(e) Removal of sediment from reservoir by excavation, draining, and flushing by
sluices after disturbing the sediment by mechanical method,
(f) Opening dam sluices to remove sediment coming in during flood time,
(g) Constructing the dam in stages,
(h) Afforestation and control of deforestation in the reservoir catchment.
Note: All the above methods can be summarized into three major types as
mentioned below.
(i) Reduction in Sediment yield from catchments (effective catchment conservation). This include:
- Environmental friendly tree planting, terracing, strip cropping, etc.,
- Check dams to reduce sediment inflow to the stream,
- Vegetal cover, grassed waterways and afforestation to reduce run off
rates and hence reducing erosion.
(ii) Reduction in rate of accumulation of sediment in reservoirs. This will include
the following aspects:
- Provision of scouring sluice at lower elevations in the dam in order to
flush out high concentration of sediments and density currents,
- Appropriate operation of gates overflow outlets and other sluices in the
dam.
(ii) Physical removal of already deposited sediments (Draging) just after
reservoir sedimentation survey (Bathmetric Survey)
Sedimentation against reservoir functions Subramanya, (2008) and Mohan Das
and Saikia (2009):
a) Sedimentation reduces the useful life of reservoir if not properly managed,
b) Outlet scouring sluices may be blocked by sediments,
c) Aggredations upstream of dam due to sediment deposition,
d) Degradation below reservoir by outflow from scouring sluices.
K.13 Estimation of Evaporation or Evapotranspiration from a Reservoir
Estimation of evaporation (E) or evapotranspiration (ET) is one of the essential
parameters in designs of reservoirs, Irrigation canals, water balance and any
project relating to water projects. Sometimes, only evaporation as a process of
water loss in vapour form due to sun radiations is enough instead of ET especially
when inside the reservoir there is negligible vegetation. The key factors for
evaporation includes solar radiation, vapour pressure, temperature, wind
velocity, atmospheric pressure, area of water surface, quality of water surface,
nature of evaporating surface, salinity of water, depth of water in the water body
and humidity (Mohan Das and Saikia, 2009).
K.13.1 Methods for Measurement or Estimation of Evaporation
The cheapest method for reservoir evaporation estimation in Water Resources
Panning is setting reasonable percentage of live capacity of reservoir as evaporation
losses through long term experience or by using different hydrological studies
within the project area. A value of 15% of live storage capacity is adopted for
major water projects and 25% of live storage capacity for minor water projects.
Generally there are different evaporation methods which include the following
(Punmia et al., 2010):
(a) Empirical formulae,
(b) Water budget method or storage equation,
(c) Energy budget equation,
(d) Mass transfer method,
(e) Combined energy and mass transfer approach,
(f) Pan Measurement method,
Mohan Das and Saikia (2009).
K.14 Different Types of Spillways
K.14.1 Introduction
Spillways are provided for storage and detention dams to release surplus or flood
water which cannot be contained in the allocated storage space, and at dams
to bypass flows exceeding those which are turned into the diversion system.
Ample spillway capacity is of paramount importance for earth fill and rock fill
dams, which are likely to be destroyed if overtopped, whereas concreted Spillway
requirements are:
- Spillway must have capacity to spill safely the excess water from the reservoir,
- A spillway must be hydraulically and structurally adequate,
- It must be located or provided with an energy dissipating outlet structure,
such that spillway discharges will not cause downstream erosion or undermine the toe of the dam (downstream (d/s) of the dam).
Design considerations: Spillway components include:
- A control structure to regulate flow into the channel,
- A discharge channel to convey the flow released through the control device
to a stream below the dam,
- A terminal structure that enables the spillway discharge to return into the
stream without scouring or erosion of the toe or downstream side of the dam.
Type of spillways:
(a) Free over-fall (straight drop),
(b) Ogee (over flow),
(c) Side channel,
(d) Open channel (through a chute),
(e) Conduit,
(f) Tunnel,
(g) Baffled apron drop,
(h) Culvert and apron,
(i) Morning glory,
(j) Drop inlet (shelf or morning glory) [This type should not be considered except
on very small dams or on off-river tributaries with very small catchments].
K.14.2 Spillway Types
A spillway is a hydraulic structure built at a dam site for diverting the surplus
water from a reservoir after it has been filled to its maximum capacity. Spillways
are classified into different types on the basis of the arrangement of the control
structure, a conveyance channel and a terminal structure. Different types of
spillways include the following (Source: The constructor, 2020):
(a) Straight drop spillway
(b) Ogee spillway
(c) Shaft spillway
(d) Chute spillway
(e) Side channel spillway
(f) Siphon spillway
(g) Labyrinth spillway
The selection of a certain type of spillway will depend on the following factors:
(a) Topography of the proposed spillway site (Steep slopes call for chute
spillway)
(b) Geological formation: the more stable geological formation the less erosive
power of the spillway, hence low operation and maintenance of the spillway
(c) Hydraulic characteristics of the flow (subcritical flow is more preferred in
side channel spillways)
(d) Availability of land for location of spillway in the constricted land, morning
glory and overflow spillways may be suitably applied
(e) Hydrological condition of the catchment (the width and height of the spillway
depends on the magnitude of the estimated flow to be evacuated)
(i) Straight Drop or free over fall Spillway
A Straight drop spillway consists of low height weir wall having its downstream
face roughly or perfectly vertical. When the water level in the reservoir rises above
the normal pool level, the surplus water falls freely from the crest of the weir.
To prevent the scouring of downstream bed from falling water jet, an artificial pool with a concrete apron and low secondary dam is constructed on the downstream side. Proper ventilation should be provided on the underside portion of a falling jet to prevent pulsating and fluctuating effects. Sometimes, an overhanging projection is provided on the crest of the weir to prevent the entrance of small discharges onto the face of the weir wall. Straight drop spillways are most suitable for thin arch dams, earth-fill dams or bunds.
(ii) Ogee Spillway
Ogee spillway, as the name says, represents the shape of the downstream face
of the weir. It is an improved form of a straight drop spillway. In this case, the
downstream face of the weir is constructed corresponding to the shape of lower
nappe of freely falling water jet which is in ogee shape. The ogee shape of the
downstream face is designed on the basis of the principle of a projectile. In general, the shape of lower nappe of the water jet is not constant for all water heads hence, the shape obtained for the maximum head is taken into account while designing ogee spillway.
Whenever there is surplus water, it will be freely disposed of through ogee spillway along its ogee shaped crest hence it can also be called as an overflow spillway. Ogee spillways are most commonly used in cases of gravity dams, arch dams, buttress dams, composite dams, etc. For gravity dams, it is generally located within the dam body. According to K Subramanya in 2012 it is suggested that, Ogee spillway with S-shaped over flow profile is the most extensively used to safely pass the flood flow out of the reservoir.
(iii) Shaft Spillway
A Shaft spillway is a type of spillway which consists of a vertical shaft followed by
a horizontal conduit. The surplus water enters into the vertical shaft and then to
the horizontal conduit and finally reaches the downstream of the channel.
The shaft constructed is either artificial or natural. Excavation for the natural shaft is possible only when the hard rocky layer is present on the upstream side. The horizontal conduit either passes through the dam body or through the foundation of the dam. In the case of large projects, the inlet hole of the vertical shaft is specially shaped which is called morning glory or glory hole of the spillway. Hence, shaft spillway is also called Morning Glory Spillway or Bell Mouth Spillway. Shaft spillway is recommended when there is no space to provide for other types of spillways such as ogee spillway, straight drop spillway, etc.
(iv) Chute Spillway
Chute spillway is a type of spillway in which surplus water from upstream
is disposed to the downstream through a steeply sloped open channel. It is
generally constructed at one end of the dam or separately away from the dam in
a natural saddle in a bank of the river. Chute spillway is suitable for gravity dams,
earthfill dams, rockfill dams, etc. But it is preferred when the width of the river
valley is very narrow. The water flows along the steeply sloped chute or trough
or open channel and reaches the downstream of the river. Chute spillway is also
called as trough spillway or open channel spillway. The slope of chute spillway is
designed in such a way that the flow should be always in supercritical condition.
To dissipate energy from the falling water, energy dissipaters can be provided on
the bed of chute spillway.
(v) Side Channel Spillway
Side channel spillway is similar to chute spillway but the only difference is the
crest of side channel spillway is located on one of its sides whereas crest of chute
spillway is located between the side walls. In other words, the water spilling from
the crest is turned to 90 degrees and flows parallel to the crest of side channel
spillway unlike in chute spillway.
Side channel spillways are preferred over chute spillways when flanks of sufficient width are not available, usually to avoid heavy cutting. The angle of turn of water flow after passing weir crest can also be kept between 00 and 90.
(vi) Siphon Spillway
A siphon spillway is a type of spillway in which surplus water is disposed to
downstream through an inverted U shaped conduit. It is generally arranged
inside the body or over the crest of the dam. In both types of siphon spillways, air
vents are provided at the bent portion of the upper passageway to prevent the
entrance of water when the water level is below the normal poll level. Whenever
the level rises above normal pool level, water enters into the conduit and is
discharged to the downstream of the channel by siphonic action.
(vii) Labyrinth Spillway
A labyrinth spillway is a type of spillway in which the weir wall is constructed in
a zigzag manner in order to increase the effective length of the weir crest with
respect to the channel width. This increase in effective length raises the discharge
capacity of the weir and hence higher water flow at small heads can be conveyed
to the downstream easily.
K.14.3 Spillway Dimensioning
The spillway is dimensioned after estimating the flood design which is a function
of peak flood or probable maximum flood estimated from the catchment that
contributes yield to the dam reservoir. The spillway is provided to accommodate
any excess water above full supply level. The governing formula depends on the
type of spillway decided by an Engineer as there are several types of spillway and
morphology.
The commonest type of spillways and simple to handle is over fall spillway (ogee/weir type) the formula was suggested by Creager, Justin, Hinds 1945 and US Bureau of Reclamation (Novack et al., 2001). This formula has to be simplified to quicken the design and it is given by:
From above the following equation the following are always assumed:
- Approach velocity (Vapr) is very small ≈ 0; the velocity that water passes over
the crest weir after heating the crest structure.
- Pressure on the spillway is greater than atmospheric
- Coefficient of discharge of discharge is in the range 0.578 < Cd < 0.745; Cd is
assumed to be 0.62
The formula is reduced and simplified to:
By using trial and error or excel program the value of weir can be computed by trying different values of hd. Different values of hd at different trials give different values of bweir and hence a need for an accurate judgment for an appropriate value to be used with respect to site conditions. The shape of the profile of the crest downstream of the apex can be expressed by using the equation:
where K and n are constants and their values depend upon the inclination of the upstream face and depend also on the velocity of approach. Typical values for K and n are given in Table K.4
Where: X = Coordinate, Y = Coordinate, O = Original of coordinates and apex of crest, Hd = Design energy head, P = Pressure zone The crest profile upstream of the apex is usually given by a series of compound curves. Cassidy reported that, the equation for the upstream portion of a vertical faced spillway as here below
Siphon Spillway
This kind of spillway at very low flows operates as a weir; as the flow increases
the upstream water level rises, the velocity in the siphon increases, and the flow
in the lower leg begins to exhaust air from the top of the siphon until this primes
and begins to flow full as a pipe with a discharge given by:
K.15 Freeboard (Fb) Estimation
This is a very important parameter in dam designing Engineering. It is the vertical
distance between the top of the dam and the full supply level in the reservoir. The
top of the dam is the highest water tight level of the structure and could thus be
the top of the water tight parapet. The free board has the following components:
(a) Rise in reservoir level due to flood routing(flood surcharge),
(b) Seiche effects,
(c) Wind set up of the water surface, and
(d) Wave action and run-up of waves on the dam.
Components ii, iii and iv are considered to be the key aspects in free board estimation and they are all sometimes termed as wave free board. Another component may be considered to account for effects of shore instabilities (rock fall, landslides etc). In embankment dams, the total free board must also include embankment and foundation (core trench) settlements as every material has its allowable settlement.
In estimating of free board the following are important:
- General engineering judgments depending on the prevailing situation of the site,
- Hydrological analysis(statistical analysis),
- Damage that would result from the overtopping of the dam.
Previous Page: DCOM_Volume_I_Appendix_J << >> Next Page: DCOM_Volume_I_Appendix_L
