Difference between revisions of "Chapter Four: Water Demand Assessment"
| Line 1: | Line 1: | ||
=Chapter Four: Water Demand Assessment= | =Chapter Four: Water Demand Assessment= | ||
| − | |||
== 1.1 WATER DEMAND ASSESSMENT == | == 1.1 WATER DEMAND ASSESSMENT == | ||
| − | + | <div style="text-align: justify"> | |
Water demand is the quantity of water that a source must produce to meet all | Water demand is the quantity of water that a source must produce to meet all | ||
the water requirements of a project. These include water delivered to the system | the water requirements of a project. These include water delivered to the system | ||
| Line 582: | Line 581: | ||
Previous Page: [[Chapter_Three:_Water_Sources_Analysis|Chapter_Three:_Water_Sources_Analysis]] << >> Next Page: [[Chapter_Five:_Pipelines_Design|Chapter_Five:_Pipelines_Design]] | Previous Page: [[Chapter_Three:_Water_Sources_Analysis|Chapter_Three:_Water_Sources_Analysis]] << >> Next Page: [[Chapter_Five:_Pipelines_Design|Chapter_Five:_Pipelines_Design]] | ||
| + | </div> | ||
Revision as of 10:59, 17 July 2022
Contents
1 Chapter Four: Water Demand Assessment
1.1 1.1 WATER DEMAND ASSESSMENT
Water demand is the quantity of water that a source must produce to meet all the water requirements of a project. These include water delivered to the system to meet the needs of consumers, water supply for firefighting, system flushing, water required for the operation of treatment facilities and amount of water lost due to leakages in the infrastructure.
In planning and designing any water supply project, water demand assessments for current and future needs are of prime importance. Engineering decisions are required to determine the area and the population, industries, institutions and other existing and emerging consumers to be served, design period, the per capita consumption of various categories of consumers’ pressure zones, amount of water likely not to be charged (NRW) and other needs of water in the area.
In addition, demand assessment may assist in determining the nature and location of various facilities to be provided such as the source of water and capacity of water storage facilities (FAO AQUASTAT, 2011 and MoW Design Manual, 2009). For effective determination of water demand, designers need to critically assess the components of water demand for the planned water supply system. The following are the main components that should be considered when conducting water project demand assessment:
- Water demand for domestic use
- Institutional Water Demands
- Industrial Water Demands
- Water Requirements for Energy Cooling Systems
- Commercial Water Demand
- Livestock Water Demand
- Water for Fire Fighting
- Operational Demands
- System water losses
- Non-Revenue Water
- Net Water Demand (revenue water)
1.2 1.2 GENERAL FACTORS AFFECTING WATER DEMAND ASSESSMENT
Demand assessment is the most critical element in project planning for short, medium or long-term water projects (Water Mission Technical Handbook of 2019 and MoW Design Manual of 2009). The complexity of water demand assessment to meet various socio-economic needs in a community may be brought about by many factors influencing individual water consumption patterns which include:
- Religion,
- Social economic status -cooking and health practices,
- Climatic conditions,
- Cultural, habits of the community,
- Age and education,
- Availability of alternative water sources,
- Level of service, technological process,
The combination of these factors may contribute to over or under estimation of the water demand in the given project area. Over-estimation of demand may justify a project that should not have been built. This then leads to unnecessary costs, over-estimation of intended revenue and premature implementation of a project. It is recommended that a thorough community survey be conducted for the project area to determine the magnitude of factors influencing water consumption pattern as described above.
The fundamental components of calculation of water demand are by determining the total population and the average daily consumption of individuals. Apart from individual based water consumption pattern, institutions surrounding the community to be served have greater influence on the determination of the overall water demand in the project area. In view of this, designers of the water supply project must take into consideration the different water consumption patterns of institutions when calculating the total water demand in the project area. For each type of institution, specific requirements should be obtained from the institutions concerned.
Water requirements for each institution must be computed separately and aggregated into the overall water demand assessment. In the rural areas, allowance should also be given for connection to schools, dispensaries, health centres, offices etc. Losses should always be determined from the gross total water requirements and not from the net. For the best conceptualization of water demand, water requirement of each sector or sub-sector must first be computed separately and later aggregated with other computed segmental demands to obtain the overall project water demand. The formula below provides general consumers whose water demand may be required:
It is worth noting that, the above formula is just a guide and should be adjusted according to the area in question. Additionally, in any assessments, demand assessment should aim at obtaining the design and operational information to optimise the net benefits to the community.
1.3 DETERMINATION OF WATER DEMAND FOR DIFFERENT USES
The foregoing section presented the components of water demand in a project. However, before establishing the project water demand, there is need to establish the water consumption of each consumer either individually or as an institution. Water consumption is the quantity of water that is directly utilized by the consumer. Water consumption is initially split into domestic and nondomestic components, non-domestic use includes Commercial Use, Institutional Use and Industrial Use, Fire Fighting and System Water Consumption.
To establish a project water demand, it is important to determine the prevailing
water project consumption categories and their water requirements. The
following steps detail a procedure to be followed when determining the project
water demand:
Step1: Establish Domestic water consumption
Step 2: Establish Institutional Water Consumption
Step 3: Establish Industrial Water consumption
Step 4: Establish Water Requirements for Energy Cooling Systems (if they exist)
Step5: Establish Commercial Water consumption
Step 6: Establish Livestock Water consumption
Step 7: Establish Net Water Demand
Step 8: Establish Fire Fighting Water consumption
Step 9: Establish Operational water consumption
Step 10: Establish System water losses
Step 11: Establish Non-Revenue Water
Step 12: Establish Overall Water Demand
Step 1: Establish Domestic water consumption
Domestic water consumption is water utilised for household chores, such as
bathing, cooking, washing, drinking, laundry, dishwashing, gardening, car washing
and other less water intensive or less frequent purposes. Individual water use
in rural, peri-urban or urban setting tends to differ considerably depending on
levels of service.
Levels of Service for domestic consumers:
The amount of water consumed depends on the level of service provided, the
following are five categories of level of service in domestic water use categories:
Category one : Low income using public taps or kiosks,
Category two : Low income multiple houses with yard tap, multiple
houses served from a single yard tap,
Category three : Low income single household with yard tap,
Category four : Medium Income Household, Medium income group
housing, with sewer or septic tank.
High Income
Household: High income group housing, with sewer or septic tank
Water use is at its lowest when water is distributed through water points (category
one level of service-public taps or kiosks) with some walking distance from the
home. When water is brought into the house by piping (regardless of whether
the location is rural or urban), the consumption increases considerably. It is
necessary to also note that there is no incentive for the consumer to utilize less
water when water is supplied at a flat monthly rate. With waterborne sanitation
and high standard of in-house installations (category five-bath, washing machine
etc) the per capita consumption may be ten times more than from a public tap.
Considerations when estimating domestic water consumption:
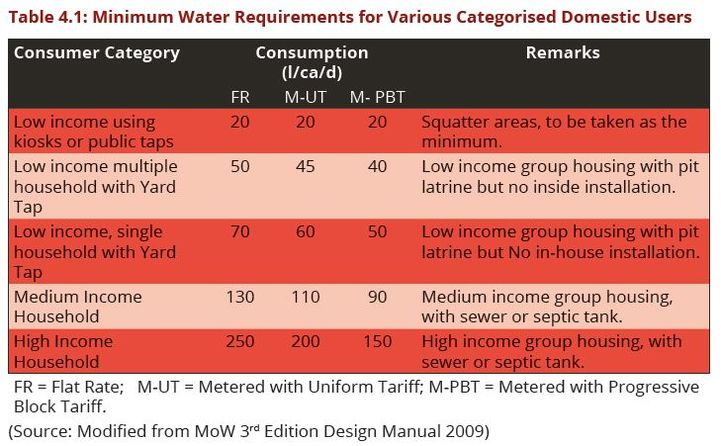
The proposed figures for water consumption rates as given in Table 4.1 are a guide
for designers. However to make an accurate estimate of the water requirements
it is necessary to consider the following:
- Decide upon the use of different per capita consumption rate if water requirement survey data from the project area justifies,
- Divide the population to be served into consumption groups as per levels of service obtained through social-economic survey data of the project area(combination of percentage of the population to be served from each service category),
- Use population density of residential plots if the data is available,
- Adjust the community water requirement if survey of alternative sources of water are available.
Establish the domestic water requirement by summation of individual domestic consumer category population multiplied by respective per capita consumption.
Step 2: Establish Institutional Water Consumption
When designing and planning for a water project, water requirements for
present and anticipated institutions in the project area have to be computed
using institutional water requirement data obtained in community survey. Public
and private institutions include: Schools, Hospitals, Administration Offices,
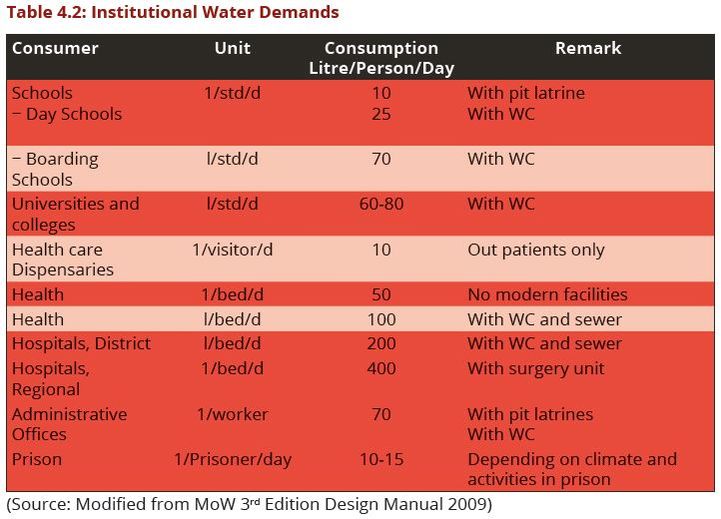
Army, Police, Missions, Churches and Mosques, Prisons, etc. In Table 4.2, some
guiding figures for institutional water unit consumption are given. For water
requirements for staff working in institutions see section 4.3.1. If large demand
units are included in the scheme, such as Universities, major hospitals, boarding
schools etc., a special study of their water requirements is recommended instead
of using the average figures given in Table 4.2:
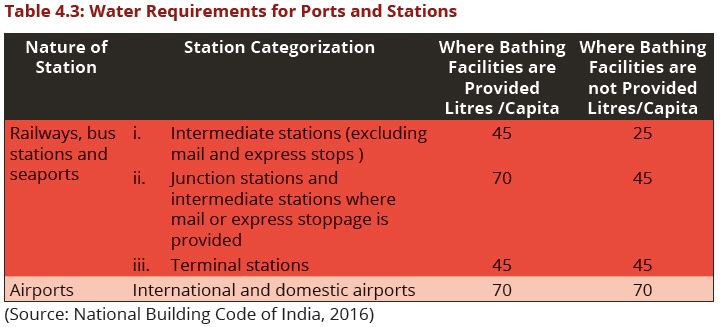
Additionally, water supply requirements for railway stations, bus stations, bus terminals, sea ports, airports including provisions for waiting rooms and waiting halls have to be considered separately in the planning and design of a water supply scheme. Table 4.3 provides general guidance for water requirements considerations in stations and ports. The number of persons should be determined by average number of passengers handled by the station daily and seasonal average peak requirements should be taken into consideration during design.
Establish the institutional water requirement by summation of individual institutional consumer category population multiplied by respective per capita consumption.
Step 3: Establish Industrial Water consumption
The water consumption in the industry varies considerably depending on the
kind and size of the industry. There are dry industries, which consume virtually
no water in their processes, and the only water consumption is that for staff
and cleaning of the premises. On the other hand, the water requirements for
wet industries such as for a paper or cotton-processing factory can be a great
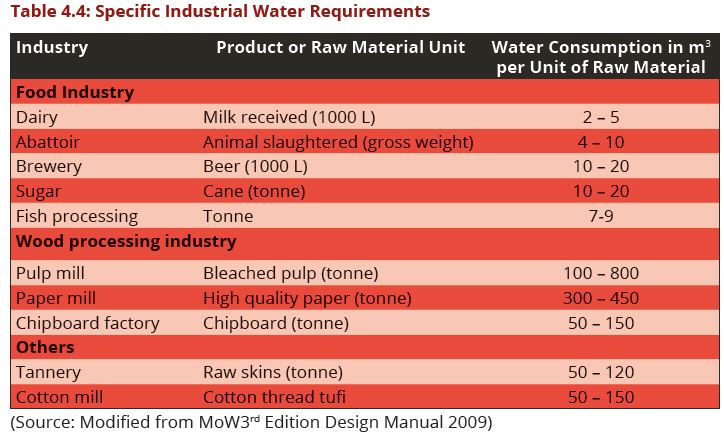
deal. Table 4.4: gives unit water consumption in different kinds of industries.
For an existing industry, the water consumption can be found out by checking
their metered consumption or if there are no records available by estimating
according to the kind and size of production. The consumption figures for larger
units must always be based on proper measurements and not on estimates.
Future projections of industrial water requirements have to be established by direct interviews with the technical management of existing industries based on their production flow sheets and by contacts with the local planning officers and local Government officials, e.g. Municipal or Council officers. For future industries to be established, the Ministry of Industry and Trade, Regional Planning Officer or organizations such as the National Development Corporation (NDC), Small Industries Development Organization (SIDO) and owners of private industries should be consulted. Where there is only a reservation for an industrial area in the town/city plan but without any specifications; estimates of the future water requirements can be based on the figures given in Table 4.5.
If the requirement of a particular industry is large compared to the existing or planned water supply system, then it will be necessary to establish the total demand and to consider identifying a separate local water source that must be examined whilst part of the requirement can be supplemented from the town or city water supply system.
Establish the industrial water requirement by summation of individual industry consumer category product volume multiplied by respective per capita consumption
Step 4: Establish Water Requirements for Energy Cooling Systems
For any water project planned in areas with a high potential for thermoelectric
investments, water intended for energy cooling systems should be separated
from the industrial demand (Kohli and Frenken, 2011). This is due to the fact that
such plants require huge amounts of water, which on some occasions may be
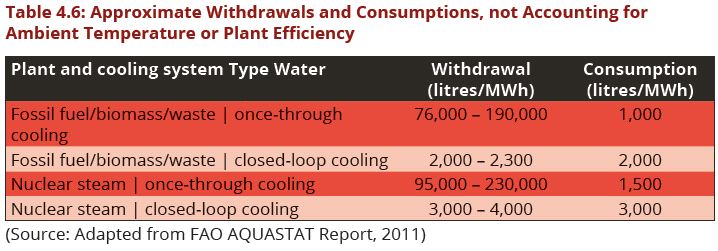
beyond the capacity of the water supply system. Table 4.6: provides guidance on
water requirements for energy cooling systems.
Establish the plant water requirement by summation of individual plant cooling
consumer category water withdrawal multiplied by respective per capita
consumption

Step 5: Establish Commercial Water consumption
Commercial water consumption is sometime considered under institutional or
industrial demands. The augmentation of such demands can cause technical
errors in the process of design and projection of water demand. Commercial
water consumption occurs in hotels, restaurants, bars, shops, small workshops,
car wash, service stations, etc. The present water demand should be known by
their metered water consumption, and at least, the bigger hotels, restaurants
and services stations must be checked. Future water requirements can be based
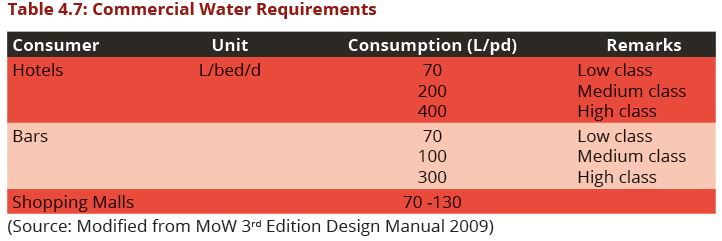
on the estimated development of this sector. Table 4.7: gives water consumption
figures for hotels and restaurants.
If there is a reservation in the town plan for the future business area without any specification, the estimates must be based on per hectare demand. As a guide, a water demand of 10 - 15 m3/ha/d for a non-specified commercial area in a new town plan can be adopted.
Establish the commercial water consumption by summation of individual commercial consumer category population multiplied by respective per capita consumption
Step 6: Establish Livestock Water consumption
The water demand for livestock can be calculated using 25 L/stock unit per day.
Water requirement for livestock should be included in water supply designs where
feasible. However, emphasis should be placed on the use of dams, charcoal and
water wells for livestock.
Applicable definitions
For the sake of assessment of water demand for livestock the following grading
of domestic animals in terms of a stock unit is to be used where one stock unit is
equivalent to:
One head of cattle, or two donkeys, or five goats or five sheep (sometimes referred to collectively as shoats), or thirty head of poultry (hens, ducks, geese). Special cases include high grade dairy cows, where one cow is equal to 2 (or 3) stock units. Present livestock numbers can be found either by counting or inquiry and then converting into stock units.
Future populations of livestock may be taken at 25% growth in 10 years and 50% growth in 20 years, respectively provided the carrying capacity of the land allows it or otherwise the present figures can be taken for the future also. This decision should be reached in consultation with the competent authorities. What is of prime importance when considering both livestock watering and horticultural irrigation is that the costs of construction and O & M of such a scheme should still be within the affordable limits of the community.
Establish the Livestock water consumption by summation of individual livestock
category population multiplied by respective per capita consumption

Step 7. Establish Net Water Demand
Net Water Demand (revenue water) is obtained by summation of all the water
demands as discussed in the foregoing sections (Domestic, institutional,
industrial, and commercial demands).
Net water demand = Domestic consumption+ Institutional consumption +Industrial consumption+ Commercial consumption + Livestock consumption + Energy cooling
This is then the potential billable water consumption or revenue water
Step 8: Establish Fire Fighting Water consumption
The determination of fire-fighting requirements is an extremely complex issue
due to the socio-economic dynamics, which might be taking place in the areas.
Fire fighting requirements are necessary in urban areas and commercial rural
centres, which are fast growing including airports and dry ports constructed in
peripheral areas. Under normal design and operation 2% of the water demand
should be set for fire fighting. It should be noted that the water supplied here
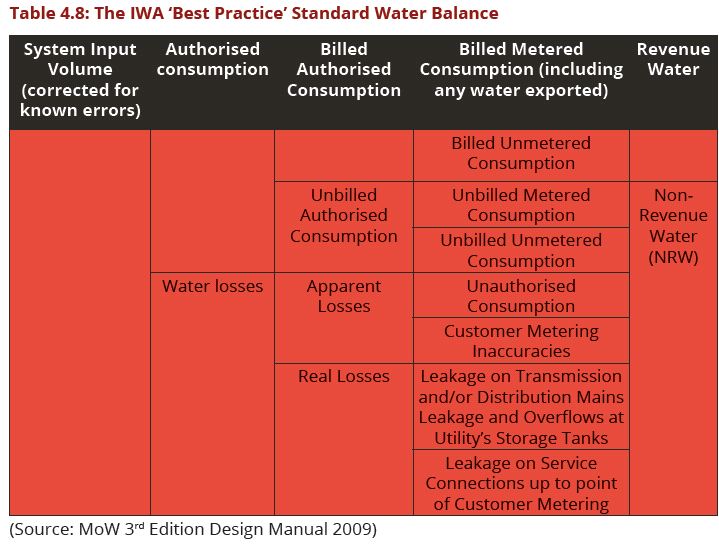
normally forms part of the unbilled authorised consumption as in the IWA
recommended water balance (Table 4.8).
The fire-fighting water requirements for industrial areas must be estimated separately. The principle should be that if the fire-fighting water demand is bigger than what is normal capacity of the distribution system, the industry in question must provide its own water reserve for fire fighting. Fire fighting reserve and storage requirement for private hydrant should be in accordance with the number of people served by a reservoir as presented in Appendix B and in the Fire & Rescue Force Regulations website available at http://frf.go.tz/pakua/
Step 9: Establish Operational water consumption
With the exception of water for fire-fighting discussed above, the operational
water demands is required for operation of the water treatment processes such
as clarifier de-sludging, rapid sand filter backwashing and chemical mixing, and
operational activities such as the flushing out of reservoirs and the pipe work
system through washouts and when cleaning bulk meter screens. Best practise
is to get a good estimation of the actual amount, however, the estimate of five
per cent (5%) is suggested for water treatment where it takes place and a further
2% for other operational demands be allowed for this water use also forms part
of the unbilled authorised consumption as explained in the IWA recommended
water balance (Table 4.8).
Step 10: Establish System water losses
In any design it is necessary to allow for water losses that are likely to occur.
These will tend to increase over time and they depend on several conditions.
Water loss in the system may take different forms including water determined
for operations so care should be taken to avoid double counting for operational
demands discussed in the foregoing sections. Technical water losses occur due
to leakages and overflow from reservoirs, treatment units, break pressure tanks,
valves, mains and distributions piping. Traditionally, it is suggested that overall,
this can be taken at between 20 to 25% of the gross water demand (gross supply).
However, experience shows that in urban areas except under the best situations,
this can grossly underestimate what actually occurs. Other losses result from
third party damage, usually resulting from either successful or unsuccessful
attempts at illegally obtaining water for consumption. Others temper with
the bills collection software to block or delay registration of funds received as
experienced by some DAWASA customers.
In the case of pipe work, loss will relate to inadequacy of design, poor pipe selection, poor quality of manufacture and installation, operating pressure and in urban areas in particular, risk of third party damage including vandalism. In a zero-failures cost approach, the loss due to these elements can be equated to zero. Losses of water due to negligence of water consumers, unauthorized abstractions from the network, third-party damage including vandalism etc., have in the past rarely been considered for design purposes. However, to ignore them, passing them off as an operation and maintenance problem that should be controlled by those in authority is but to pretend the problem does not exist. Not only in estimating revenue should this element be considered but also in designing, specifying and implementing projects. Again, where the zero-failures cost approach has been adopted the losses attributable to vandalism should be minimal and can also be equated to zero.
Vandalism and illegal connections vary enormously. In small Tanzanian towns with a continuous water supply, a relatively small proportion of urban poor and with good controls, it can be quite small. In larger towns, with large populations of urban poor and irregular or rationed supply the same can be very significant.
Step 11 Establish Non-Revenue Water
Non-Revenue Water (NRW) in the supply system can originate from different
causes including expected and un-expected causes. The designer for a water
supply project has the responsibility to determine the possible amount of
unaccounted for water likely to be experienced in the system to be constructed.
More often, during planning and designing stages, Non – Revenue Water is
neglected or partially computed through water loss calculated in the treatment
units. Table 4.8 (IWA water balance) provides guidelines, which may be employed
to come up with possible NRW in the water supply system. In case the water
loss has been determined as explained in the foregoing section, the designer
will have to undertake analysis to determine the likely sources and percentage
of unbilled authorised consumption and then incorporate it in the appropriate
system component.
Establish the Non-Revenue Water (NRW) by summation of unbilled authorised consumption and water losses.
Step 12: Establish Overall Water Demand
Water demand is calculated by summation of all the consumption categories
(Net Water Demand) explained in the preceding sections and making allowance
to NRW (normally expressed as a percentage of whole consumption),
However, in estimating water demands discussed in the above sections, variations in water consumption must be taken into consideration. The following section discusses the variations in water consumption that the water supply designers should take into consideration
1.4 VARIATIONS IN WATER CONSUMPTION
1.4.1 Definitions
Though water demand is normally calculated according to the average
requirements, actual consumption varies from hour to hour and from day to
day. Due to this non-uniformity of water demand, provision needs to be made
in different units of the water supply system to cater for these variations. To evaluate the importance of variation in water consumptions, the following
definitions are relevant:
- Average Annual Demand (Qaa) - The total volume of water delivered to the system in a full year expressed in cubic meters. When demand fluctuates up and down over several years, an average is used.
- Average Daily Demand (Qda) - The total volume of water delivered to the system over a year divided by 365 days. The average use in a single day is expressed in cubic meter per day.
- Maximum Month Demand (Qmmax) - The cubic meter per day average during the month with the highest water demand. The highest monthly usage typically occurs during a summer month.
- Peak Weekly Demand (Qwmax) - The greatest 7-day average demand that occurs in a year expressed in cubic meter per day.
- Maximum Day Demand (Qdmax) - The largest volume of water delivered to the system in a single day expressed in cubic meters per day. The water supply, treatment plant and transmission lines should be designed to handle the maximum day demand.
- Peak Hourly Demand (Qhmax) - The maximum volume of water delivered to the system in a single hour expressed in cubic meter per day. Distribution systems should be designed to adequately handle the peak hourly demand or maximum day demand plus fire flows, whichever is greater. During peak hourly flows, storage reservoirs supply the demand in excess of the maximum day demand.
Summary of relationships between patterns
For design purposes, the peak factor shall be selected by giving consideration to the size and kind of the scheme and services required. Generally, an intake and the supply main from the intake to the treatment works is dimensioned to meet the peak day demand. For gravity schemes this means a main designed for a flow during 24 hours, while for pumping main the design flow is according to the pumping hours decided upon. This gives the minimum size of pipe required and where the water is treated, the required ultimate dimensions of the treatment units.
1.4.2 Variation in the Rate of Consumption
The average-rate of supply per capita is in fact the mathematical average taken over an average year. Thus, if Q is the total Quantity of water supplied to a population ‘P’ for 365 days, then the average rate of daily consumption ‘q’ is given by the following equation:
q = Q/(P x 365) litres/capita/day (4.10)
The types and nature of variations of demand of which ‘q’ is an average are given below.
1.4.2.1 Diurnal Variation in Water Demand
The consumption of water is not uniform throughout the day. Generally, two peak periods of demand are observed, one in the morning and one in the evening. The maximum intensity of demand which occurs in the morning varies between about 1.5 and 2.4 times the average demand for the day depending upon the size of the population served.
Large impounding reservoirs are designed to cater for the variations in demand and to ensure a steady delivery of water for a period from one drought year up to three consecutive dry years. For the supply channels and mains for the conveyance of this water to the treatment works, a figure of between 1.35 and 1.50 times the average demand rate ‘q’ is used. The pumping stations and treatment units are usually designed by taking 1.35 to 1.5 times the average demand rate since they are to meet the peak seasonal requirements. If the pumping is for less than 24 hours, then the above rate must be multiplied by the ratio of 24 hours to the hours of pumping. Transmission mains are designed to meet peak daily demand although distribution mains in the supply area are required to meet peak period demand and in urban areas are designed for up to 2.5 times the average rate of demand.
1.4.2.2 Peak Factors
Though peak factors are necessary for calculating the actual peak period demand, application in individual cases is difficult. The population data such as the number of people using each water point, number of hours per day, people’s habits in collecting water is difficult to obtain and again may vary by season or by school calendar. Hence use of peak factors to calculate an individual’s demand is impracticable and the figures given in Tables 4.9 and 4.10 are simply rough guides. Peak factors however, must be adopted for the dimensioning of the various components in a water distribution network. For every scheme, a study is required to establish the appropriate water demand and for large schemes it must be done thoroughly.
For small rural water supply schemes, a simpler method may be adopted to derive peak flows beyond the last storage tank with the peak flow for human consumption being given by the expression:
(Average daily demand × 4) / 24 (4.11)
That assumes the peak demand is four times the average hourly demand or in other words the daily demand is drawn over 6 hours during the two peak periods of the day.
For livestock, the usual practice is to work on the basis of a ten-hour period such that the peak flow may be taken as:
Daily livestock demand / 10 (4.12)
Thus in small rural water supply schemes providing water both for human consumption and livestock, the peak flow used for dimensioning of the distribution mains is the sum of the peak flow for human consumption and the peak flow for livestock consumption.
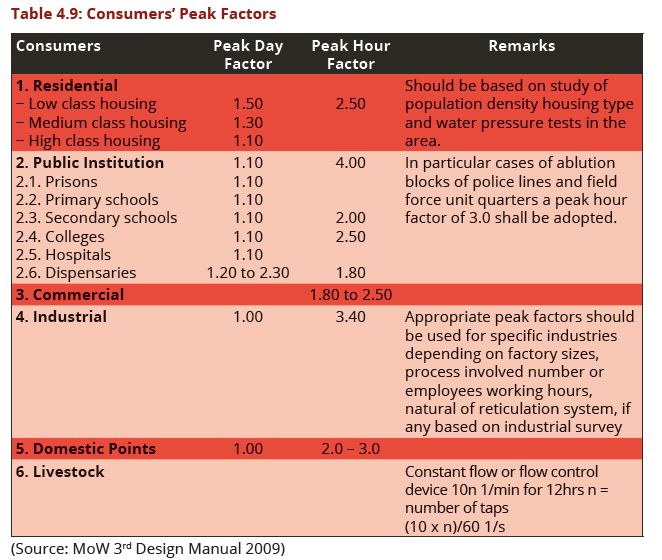
In many urban areas and particularly in those that have experienced past restrictions in water supply, a number of consumers and especially those in high cost areas and institutions etc., will have constructed their own ground level or below ground storage, often well in excess of their daily requirements. In such instances, the actual peak hour flow can be noticeably less than 2.5 indicated in Table 4.9. In the absence of information to the contrary, peak factors that may be used for different consumer categories are as given in Table 4.9:
When it is impossible to separate consumers into categories as given in the previous table, but the total population of the area is known Table 4.10, can be used as a guideline.
1.4.3 Predicting Water Demand
It is advisable to project demand for short, medium- and long- term periods and to update this at least every five years. The Water Mission Handbook, 2019 provides guidance on means of computing the water demand in various situations. It categorizes demand predictions into three levels namely:
i. Maximum Demand After Commissioning This is calculated by assuming that 100% of the members of the population will each use full individual consumption amount. Therefore MDAC = Total population Served x Maximum individual consumption.
ii. Anticipated Demand After Commissioning (ADAC) This is computed based on the assumption that not all 100% of population in the community will use the maximum amount of water. So predictions of the percentage of the population that will use the water need to be estimated. Additionally, it may be decided that individual consumption may be less than full amount determined in the time period just after commissioning of the system.
iii. Maximum Future Demand This type of water demand is computed to determine the system sustainability and capacity to meet the future demand growth. It is worth to note that the future demand can be hard to predict. However, inputs like population growth, migration, trade, urbanization and any significant changes in the national policies can be used to facilitate determination of projected future demand in the project area using data from the National Bureau of Statistics (NBS).
The population growth rate (r) is among the factors, which are predominantly used to facilitate the computation of the future demand. The future population in a project area may be computed using the following formula.
Pn = PO (1 + r / l00)n .................................. (4.14)
Where,
Pn = population after n years,
PO = present population, and
r = annual growth rate (%)
Once the predicted future population is determined, it can be multiplied by the anticipated population to be served and individual consumption to determine the maximum future demand (MFD).
1.4.4 Design Water Demand
All three calculated demands will have an impact on the safe water system design. It is recommended that the system be initially designed to meet the Anticipated Demand After Commissioning. Once that design is completed it can be compared to the Maximum Demand After Commissioning and the Maximum Future Demand. If the design can meet all the three calculated demands, this increases the confidence level of the design. However, if the design does not meet the other two demands, this does not necessarily mean that the design should be changed.
Instead, the design engineer can establish what changes could be made to meet the other two demands. If meeting these would take a minimal amount of additional equipment and cost, then doing so would be appropriate. However, if meeting the other two demands would take a large amount of additional equipment and cost, then it may not be economical or practical. Under such situations, decisions will have to made after discussing with the authority or the client. The first consideration tobe considered should be to increase the storage capacity of tanks.
REFERENCES
Amit Kohli and Karen Frenken (2011). Cooling water for energy generation and its impact on national-level water statistics: http://www.fao.org/3/a-bc822e.pdf
FAO AQUASTAT Report, 2011
MoW(2009). The 3rd Edition Design Manual, 2009
Marco, Farina et al (2011). Water consumptions in public schools. Available online at www.sciencedirect.com
Reynolds, C., Steedman, J.C. and Threfall, A.J. (2008). Reinforced concrete Designers Handbook.
Francis and Taylors.
Water Mission Technical Handbook of 2019: Version 1.2
Water Sustainability in Prisons: Water Efficiency: The Journal for Water Resource Management.
http://digital.waterefficiency.net/display_article.php?id=2349297&view=284543.
Retrieved on 29th December, 2019
Previous Page: Chapter_Three:_Water_Sources_Analysis << >> Next Page: Chapter_Five:_Pipelines_Design


