Chapter Nine: Design of Water Structures
Contents
1 Chapter Nine: Design of Water Structures
The main components of a water project include water intakes, break pressure tanks, water points, valve chambers and storage/sedimentation tanks. The following sections describe the design procedures for various water structures.
1.1 SIZING AND LOCATING WATER STRUCTURES
1.1.1 Tanks
1.1.1.1 Storage tanks
The primary purpose of water storage tank is to balance supply during peak hour demand. It is typical to have two peak times during the day, one in the morning the other in the evening when large amounts of water is collected. Water storage tanks should be positioned on higher ground relative to the supply area so as to command pressure.
The following design points should be considered as procedures when estimating the water tank volume/capacity
- Estimate tank capacity by calculating the water demand at various times of the day and comparing that to the yield of the water supply scheme,
- Establish the demand and supply patterns for a typical day during the assessment phase of the project
- The supply yield pattern of the project depends on the design operation period for pumping systems,
- Consider providing tanks for solar-powered projects as they have limited pumping hours,
- Establish the tank volume based on the amount of water needed from the time when there is more water leaving the tank than entering the tank (demand> supply) until the time when there is more water entering the tank than leaving it (Supply > Demand),
- Size the water tank volume so that it is able to meet the deficit during these hours,
- Calculate the volume of the tank by comparing the supply with demand at incremental time periods and balance to the existing storage,
- The balance should start at zero, then calculated for each time period (iteration) by adding the surplus or deficiency to the balance of previous iteration.
This is represented below, with n representing the iteration.
Balance n = Surplus / Deficiency n + Balance n-1
The necessary tank capacity (V tank) is then calculated as the maximum balance (V max) minus the minimum balance (V min) minus the final volume (V final).
V tank= V max – V min –V final (9.2)
Refer to Appendix C example of the sizing of tanks.
1.1.2 Sedimentation/Settling Tanks
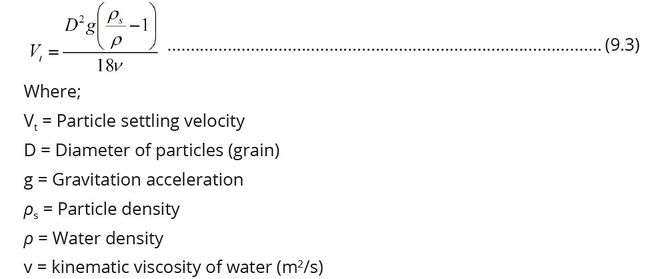
Settling Tanks and clarifiers should be sized based on the settling velocity of the smallest particle to be theoretically 100% removed. Settling velocity of particle may be determined using Stokes law:
Particle characteristics (diameter and density) may be determined in the laboratory through standard methods. Particle settling is governed by the condition that the settling velocity of a particle (Wt) should be less than the settling tank overflow rate (Vo). The settling tank overflow rate (Vo) is defined as:
Overflow rate (Vo) = Flow of water (Q (m3/s)) / (Surface area of settling basin (A)(m2)) (9.4)
Settling tanks and clarifiers may be designed as long rectangles after calculating the surface area, rectangular shapes are hydraulically more stable and easier to control for large volumes. Factors such as flow surges, wind shear, scour, and turbulence may reduce the effectiveness of particle settling. To compensate for these less than ideal conditions, it is recommended to double the area determined from theoretical calculations. It is also important to equalize the water flow distribution at each point across the section of the basin. Poor inlet and outlet designs can produce extremely poor flow characteristics for sedimentation.
Sedimentation efficiency does not depend on the tank depth. If the forward velocity is low enough so that the settled material does not re-suspend from the tank floor, the area is still the main parameter when designing a settling basin or clarifier, taking care that the depth is not too low.
1.1.3 Break Pressure Tanks
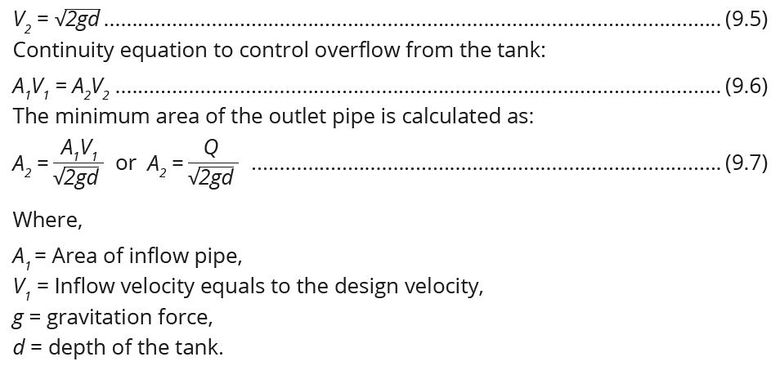
Break pressure tank is a structure that is located between a water reservoir and supply point with the aim of reducing the pressure in the system to zero (atmospheric pressure). Conventional break pressure tank is constructed of concrete in rectangular shape with the depth of the tank about 1.2m. The design criteria for the break pressure tank is to find such that the minimum diameter of the outlet pipe can convey the design flow without causing the overflow in the tank.
Example:
Consider:
Free flow in the tank at depth d conveyed to outlet pipe at velocity V_2:
Choose the dimension of the tank at d values ranging from 1.0 m -1.5 m, length and width of the tank between 1 m to 3 m. The sizing of break pressure tank may be calculated based on the following specifications:
1.1.4 Water Intakes
This is a structure built in the body of water to draw water from the water source. The source may be a canal, river, spring, lake or dam usually built as an integral part of the source. The intake consists of an opening, a strainer or grating through which water enters and conduit conveying the water usually by gravity to a well. These structures are masonry or concrete structures and provide relatively clean water, free from pollution by sand and objectionable floating material.
a) Function of Intakes
The main function of an intake is to provide the highest quality of water from the source and to protect pipes and pumps from being damaged or clogged by wave action, floating objects/debris and submerged marine objects or creatures.
b) Consideration for Locating water intake structures
The following general considerations should be taken while designing and locating water intake structures:
- The source of supply should not have wide fluctuation in water level,
- The site selected should be able to admit water even under lowest flow conditions in the river. Generally, it is preferred that intake should be sufficiently below the shoreline,
- The proximity of the intake structure to the treatment plant,
- Good foundation, away from navigation requirements, safe from effect of floods, storms and scouring in the bottom,
- It should be placed at a location that is free from pollution. It is better to provide the intake at a location reasonably far from settlements so that the water is not contaminated,
- Away from locations with a high frequency of floating materials such as ice, vegetation and logging,
- Intake capacity must be large enough to meet the requirement of design discharge,
- It should not interfere with river traffic if any.
- It should be located where good foundation conditions are available,
- It should be located so that it admits relatively pure water free from mud, sand and pollutants.This implies protection from rapid currents,
- It should be created on the erosion side of a river bend and not the deposition side.
c) Considerations for design of various types of water intakes
(i) Reservoir intake
The water in a reservoir is likely to vary in quality at different levels. This feature makes it usually desirable to take water from about 1 m below the surface. Due to fluctuations in water level, it is desirable to have entry ports at various heights with gate valves. These gate valves are used to regulate water supply. When the water level goes down, a gate valve of a lower port is opened. Access to the ports is through an operating room.
(ii) River intakes
A river intake should consist of a port (conduit) provided with a grating and a sump or gravity well. The conduit should be supported on pillars 1-2 m above the bottom to prevent entry of silt. Also it is kept 1 m below the top surface to avoid entry of floating debris. Velocity should be kept at less than 0.15 m/s to prevent the entry of small fish. River intake structure should be constructed upstream the point of sewage disposal or industrial wastewater disposal. River intakes may need screens to exclude large floating matter. The bottom of the river intake must be sufficiently stable.
(iii) Lake intakes
If the lakeshore is inhabited, the intake should be constructed such as to minimize the danger of pollution. The intake opening should be 2.5 m or more above the bottom so that the entry of silt with water is minimized. The water entry velocity must be low to exclude floating matter, sediment, fish or ice. Entering velocity of 0.15 m/s is usually used. Offshore winds tend to stir up sediments which will be carried for long distances. So, intakes must be located at a distance of not less than 600 meters from the shoreline. Such intakes are recommended to be of multiple level intakes to ensure the source can cope with climate change impacts.
(iv) Intake conduit
Intakes located at long distances from the pumps usually deliver their water to the pump well at the shore end by gravity. This requires a large pipe or conduit so that the velocity is low. But velocity should not be too low to allow for the occurrence of sedimentation. The conduit may be a submerged pipe or tunnel. A submerged pipe should be protected by burying it in a trench, surrounding it with rock or held in place with piling.
1.1.5 Dams
A dam is a structure built across a stream, a river, or an estuary to retain water. Dams are built to provide water for human consumption, for irrigating arid and semiarid lands, or for use in industrial processes.
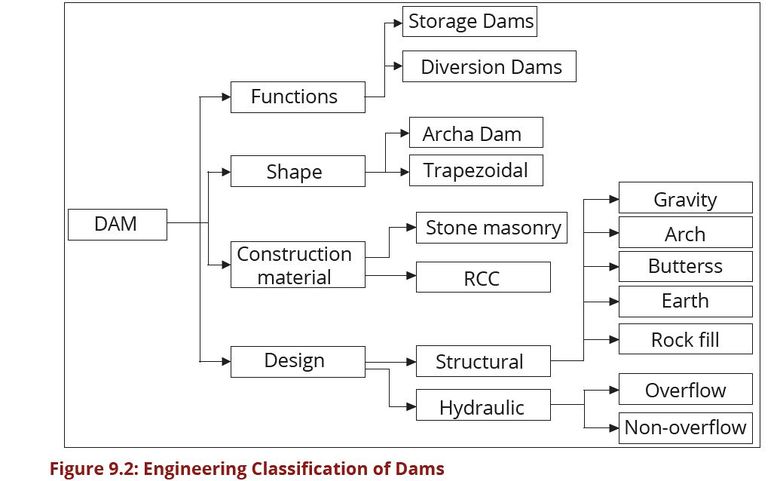
1.1.5.1 Engineering Classification of Dams
Dams are classified according to their function, shape, construction materials and design. This is termed as engineering classification. Figure 9.2 presents a typical dam engineering classification:
Under structural classification, there are several dam type namely; gravity, arch, buttress, earth fill and rock fill. The Ministry of Water has inventoried about 710 dams whose information has been recorded in a database. As per the inventory, more than 99% of these dams are earth fill and rock fill dams and the rest fall into other categories. Due to this fact, the emphasis of this manual is on earth fill and rock fill dams to guide their design, construction and Operation and Maintenance.
1.1.5.2 Size classification of dams
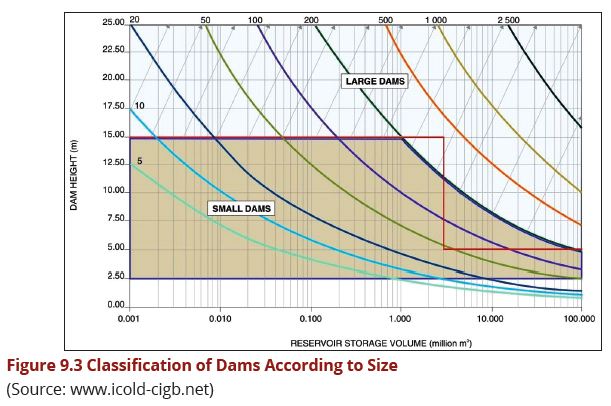
(a) Large dams
According to International Commission on Large Dams (ICOLD), large dams are
those having capacity of 3million cubic meters or more and a height of more than
5 meter as summarized by the expression below:
5<H<15m and V>3Million cubic meters.
Where:
H is height in meters above riverbed level to maximum crest level,
V is storage volume in million at Maximum Operating Level=Full Supply
Level in most cases.
(b) Small Dams
Small dams have height of less than 2.5m and the product of H2√V and should be
less than 200 as indicated here below:
2.5<H<15m and H2√V <200
Note: (*) Minimum dam height can be changed to 2 or 3 m in the case of dams in
residential or very populated areas.
Also, note: For flood retention dams holding no water the storage volume at crest
of spillway level (design storage volume) should be used.
In Figure 9.3, the ICOLD classification (www.icold-cigb.net) of dams based on size
is presented:
The focus of this manual is on large dams. Small and sand dams are covered in the rainwater harvesting guidelines prepared by the Ministry of Water and thus a designer should consult the relevant guidelines as appropriate.
1.1.5.3 Feasibility investigations
During the feasibility study all data and related information of the project should be collected and analysed. The following are the detailed guidelines for conducting feasibility studies and preliminary designs of a dam project. Note that, in this manual, the emphasis is on earth fill dam as the dominant dam type in the country.
(a) Topographical Survey
Once all preliminary investigations have been made and a suitable dam axis has
been selected, the next step is to carry out a detailed survey of the valley and
reservoir area to allow for more accurate estimates of quantities and to provide
the necessary data for appropriate design work to be undertaken. The aim of
such a survey is to present, on paper, contour map of the reservoir up to and
exceeding the maximum flood level, and to provide details for the location of the
embankment, spillway and outlet works. From the contour map, the capacity of
the reservoir can be assessed by varying dam heights.
The topographical survey works can be conducted by using different techniques
depending on the site condition, size of the catchment, availability of resources
and level of accuracy required. Light Detection and Ranging (LiDAR) survey, drone
(Aerial), Differentials GPS (Real Time Kinematics-RTK), Totals station and ordinary
levelling survey may be deployed during the topographical survey. The required
contour map should range from 0.25m to 1.0m contour interval depending on
the topographical characteristics of the area. Note that the contour interval
is directly proportional to accuracy of the estimated volume of reservoir. The
elaboration of the survey techniques used for topographical data collection and
analysis are as provided here below.
(i) Grid survey
This is a simple and straightforward but time-consuming method. It may not be
appropriate if the area is heavily vegetated and/or physically inaccessible.
(ii) Cross-sections
Cross-section surveys are taken along various lines within the river valley(s) from
benchmarks previously established. Levels are observed at set intervals and
outstanding features (changes of slope in particular) are also noted.
(iii) Spot heights
This is especially suited for larger areas. A circuit of benchmarks is established
and spot height observations with bearing, distance and elevation are made
from each station. For smaller dams, and if a theodolite or electronic instrument
is used, it may be possible to take all the readings from one station. Alternatively,
reasonably accurate GPS surveys can be used to establish a network of elevation
readings across the site.
(iv) Aerial survey
This does not have much difference from the spot heights. However, this
technique deploys plane (LiDAR) and drone to conduct topographical surveys of
the proposed dam catchment area. The major advantage of this technique is that
it is time-saving and the major disadvantage is its high cost compared to other
techniques. Therefore, this technique is more suitable for large projects.
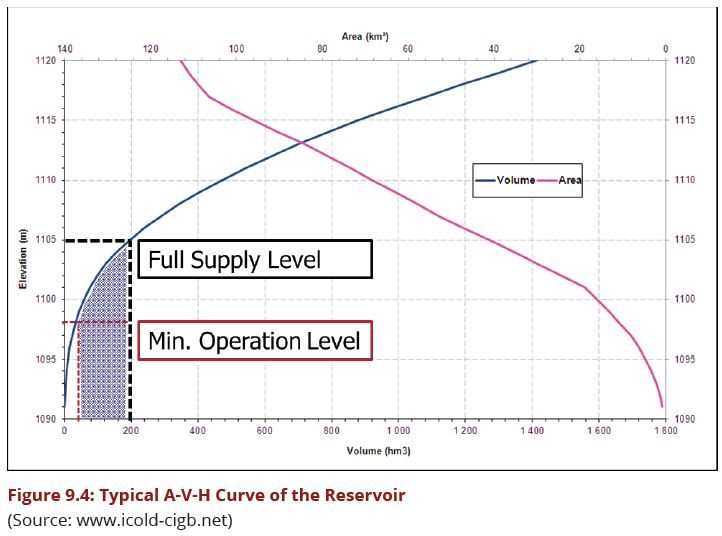
The output of the topographical map is a depth-capacity curve and can then be
drawn up to provide a quick and easy method for the dam designer to choose the
optimum full supply level. Figure 9.4 represents the area capacity depth curve:
1.1.5.4 Hydrological Analysis of the Water Catchment Area
Hydrological analysis is a very important aspect to be considered when designing any hydraulic structure. During a hydrological analysis of a catchment, three design issues should be considered which are:
- Water yield of the catchment,
- Design flood and
- Sediment accumulation in the reservoir.
In Tanzania, some of the rivers are un-gauged which calls for the use of empirical formulae in the estimation of reservoir inflows and spillway capacity of a dam. In the absence of direct measured flows of rivers, the catchment yield is estimated based on rainfall run off models.
Steps to be followed in conducting hydrological analysis of a catchment
Step 1: Determine the amount of data required for the analysis
Rainfall data is required for the probability rainfall analysis, flood analysis and
water availability analysis. For this reason, existing rainfall data from several
sources have to be collected and reviewed, including: daily rainfall, monthly rainfall,
monthly discharges, daily mean discharges and other hydro-meteorological data
which are used as part of the input rainfall runoff modeling.
Step 2: Assessment of Watershed Rainfall Records and gap filling of rainfall
data
In watershed work it is often necessary to know the average depth of rainfall
over an area. The rainfall data used includes daily amounts as measured at rain
gauges. Rainfall data is required for probability rainfall analysis, flood analysis
and water availability analysis. Missing data may be interpolated using several
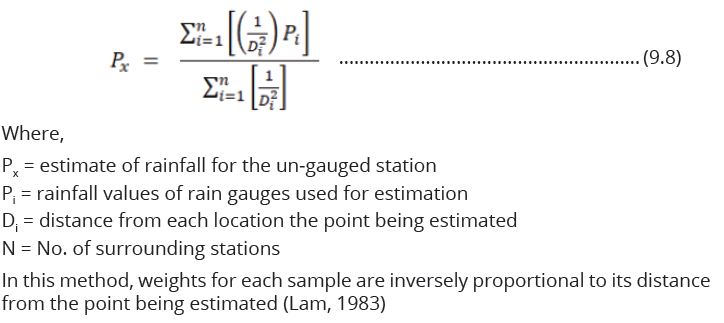
methods and in this manual Inverse Distance Squared Method is suggested to
be used and compared with other methods available in different references as
indicated below.
Step 3: Estimating Average rainfall depth
Beside other methods, Thiessen is user friendly for estimating watershed Average
rainfall depths using a rain gauge network. In the Thiessen method, the watershed
area is divided in sub areas, using rain gauges as hubs of polygons. This method
and other related approaches are explained in hydrological literature.
Step 4: Assessment of Runoff flow records
Daily river flow records collected within the catchment area and contributing to
the proposed reservoir should be used for runoff estimation.
Step 5: Rating curve
In order to transform the hydrometric levels into flow values, it is necessary to
process a rating curve for each of the stations being considered. The calculation
of the rating curve consists of estimating the parameters of a fitting function on
known pairs of level-flow values. The fitting function is specifically chosen so that
it can mathematically adapt to the experimental points. The look up function in
spread sheet should be deployed to estimate the discharge from the known pair
of level-flow. The following is the basic equation used to estimate the discharge
from water level data measured in the river.
H --> Q Q = a(H – b)c......................................................... (9.9)
1.1.5.5 Geotechnical Investigation
(a) The purpose of geotechnical investigation
The following are the purposes of geotechnical investigation for dam design and
construction:
(i) To evaluate the parameters of soil/rock at the proposed site,
(ii) To assess the engineering parameters and to estimate the safe bearing
capacity of dam foundation,
(iii) Drilling borehole in order to know the stratification and conducting necessary
field tests and to collect samples for laboratory testing,
(iv) Testing soil samples in the laboratory to determine the physical and
engineering properties of the collected samples, and
(v) Analyzing all field and laboratory data to evaluate safe bearing capacity for
given foundation sizes and necessary recommendations for foundation
design and construction materials.
(b) In-situ Tests
The level of geotechnical investigation depends much on the size of the dam
project, surface geological characteristics, topographical and geomorphological
characteristics of the site. The geotechnical investigation mainly is subdivided
into main three categories.
To obtain the geotechnical properties of the foundations of major structures
including dam, spillway and weir, the in-situ tests are carried out in the boreholes
and trench pit field test including standard penetration test and plate load test
in soil and weathered zone dilatometer test to identify strength a different
stratification of the geological formation, as well aswater pressure test in the
bedrock (Hydraulic Conductivity of the Geological formation).
Investigation of the underlying geological formation of the dam site
In order to analyze the formation of the underlying rock of the dam site, different
techniques are deployed. For small scale investigation which is conducted in
soft formation, augering is used while in hard formations deployment of heavy
equipment is highly recommended through coring. The core samples are
analyzed to determine faults and stratification of the underlying geology of the
dam and reservoir sites.
Soil Sampling for Laboratory Test
Soil sampling is conducted in order to determine mechanical and chemical
properties of the geological formation and construction materials collected from
boreholes. Recommended soil tests for design of the embankment dam are
detailed on section 12.4.4.
1.1.5.6 Design of Dams
(a) Design (Spillway Dimensioning) Flood by rainfall runoff model
The aim is to evaluate the extreme floods to be adopted for the design of a dam and
the pertaining hydraulic structures. More in detail, the hydrological elaborations
estimated are expected to satisfactorily assess the flood associated to several
return periods. Two methodologies may be adopted for the hydrological study
for the purpose of constructing hydraulic structure such as dam namely:
- Probable rainfall,
- Rainfall-runoff model.
Different distributions, including two parameters log-normal, three parameters log-normal, Gumbel and Log Pearson type-III have to be compared. It is noteworthy that since the historical runoff time sets are quite limited in some catchments, the prediction of the extreme flood with high return periods with statistical methods can lead to results on significant uncertainties.
The transformation of rainfall into runoff to estimate the peak flood and the entire hydrograph at the section of interest should be developed. The hydrological models can allow the estimating of the Probable Maximum Flood (PMF) i.e. the greatest flood physically possible over the catchment of interest.
Probable rainfall by frequency is calculated by statistical analysis on annual extreme series data. The daily maximum rainfall according to various return periods through two parameters log-normal, three parameters log-normal, Gumbel and Log Pearson type-III distribution.More information on statistical approaches can be found in appendix J.
The return period (sometimes called the recurrence interval) is often specified rather than the exceedence probability. For example, the annual maximum flood flow exceeded with a 1 percent probability in any year, or chance of 1 in 100, is called the 100-year flood. In general, Xp in the T-year flood is computed as follows
T = 1/ (1-p) .......................................................................... (9.10)
After geotechnical investigation and soil testing, hydrological analysis, sediment analysis, detailed topographical survey and Environmental and Social Impact Assessment the following stage is to conduct a detailed design and cost estimate of the project. The cost of the project should form a basis for economic analysis of the entire project. During economic analysis of the project the cash flow is prepared which defines the payback period of the project. This chapter is not prepared to guide the users on project economic analysis since the matter is covered in other chapters of the manual.
The design section focuses on earth fill and rock fill dams and other types of dams may be designed using international guidelines.
(b) Reservoirs, Dams and their Spillways
Reservoirs
A reservoir is required when the minimum daily design flow at the intake site plus
any minimum compensation release requirement is less than the average
daily demand. It is a basin constructed in a valley of the stream. For storage of
water, weirs may be constructed if the difference is small but if the difference is
appreciable, an earthen dam, masonry, rock fill, concrete dam may be constructed
across the stream for storage
Site Selection
Site selection criteria have been defined in the pre-feasibility study and more
elaborated in feasibility study section. Therefore, the design section deploys
the information gathered from other studies of the project and are highlighted
below.
The site for an upstream or mainstream Reservoir and its Dam should be selected such that it may command the entire area without pumping. The following main features should be considered for the selection of a site of such an impounding reservoir:
(i) It should be on impermeable strata, i.e. permeability coefficient (k) should
be less than 10-7 m/sec.
(ii) A narrow opening in the valley should be selected to reduce the length of
the dam.
(iii) Objectionable salts and minerals soluble in water should be absent from the
reservoir site so that the water is of acceptable quality.
(iv) The land to be submerged should be relatively unoccupied and cheap, i.e.
involve least compensation and observe laws of environment conservation.
(v) The land should be free of marshy layers and vegetation which could affect
the colour, odour and taste of water.
(vi) The slopes of the basin should be steep so to reduce the surface area per
unit of volume in such a way that both undesirable shallow water and surface
evaporation can be minimized.
(vii) The valley of the stream in which the dam is to be constructed should be
rapidly widening upstream of the dam so that it may afford the greater
average volume per metre height and length of the dam.
(viii) The capacity of the reservoir should be such that it will ensure the total
demand of water for the town to be delivered continuously. The capacity
depends upon the climatic conditions of locality and the period of dry
weather.
(ix) The dam site should not be located over a fault line parallel to the stream
bed.
(x) The storage capacity in regions of dry climate, long droughts and infrequent
rains will be more than that of the regions of moist climate and of frequent
rains, and an initial estimate can be made using Hawksley’s rule.
D = 1600/√F ....................................................................... (9.11)
Where:
D = the number of days for which the supply is to be stored,
F = the mean annual rainfall of three consecutive dry years expressed in cm.
(xi) If the stream brings large quantities of silt, debris, etc., the storing capacity
will be reduced due to considerable accumulation. It should be taken into
account by providing extra storage (called dead storage) which is normally
1/4- 1/5 of the total storage. The actual amount of dead storage depends on
the silt load and design period adopted. As far as practicable, silting should
be controlled. The sediment analysis of the reservoir should be computed
based on the available information from the manual. Details of other design
steps are presented in Appendix K.
1.1.5.7 Boreholes
1.1.5.7.1 Groundwater Analysis
(a) Geology
Geological information is of great value to every hydrogeologist, as it indicates
the extent of water bearing layers and less pervious layers, both in a horizontal
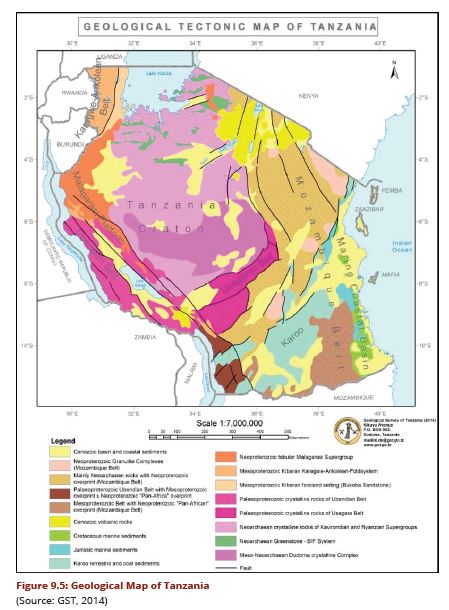
and in vertical direction. A simplified geological map of Tanzania is shown in
Fig. 9.5, together with its key.
Hydrogeologically, rocks may be considered as falling into one of the two groups
as follows:
(i) Sedimentary rocks
These rocks are the result of eroded sediments from source rocks. Sedimentary
rocks are composed of silicate, carbonate and clay minerals. The rocks rarely
occur as single units and younger beds are usually laid down upon older ones.
However, the sequence may be disturbed or extensively folded and faulted.
The occurrence of groundwater in sedimentary formations is generally found in sandstones, carbonates and unconsolidated materials. The sandstone formations are rated as highly productive aquifers due to both their primary and secondary porosity and permeability. The Calcareous formations are also good aquifers due to solution process taking place at later stages (karstification). Unconsolidated formations are regarded as good aquifers due to both weathering and depositional processes resulting in the formation of sand dunes, alluvial fans, floodplains, buried river channels, etc.
(ii) Igneous and metamorphic rocks
Igneous rocks may be classified into two types: extrusive and intrusive. In extrusive
rocks (volcanic) such as tuff, andesite, basalt, etc., water occurs in fractures and
pyroclastic materials. The intrusive and metamorphic rocks termed as hard rocks
are mainly granites and gneisses, respectively. They are solid and non-porous but
can hold water in networks of cracks, joints, fractures or faults or along contacts
between rocks of various types, as in the case of dikes and sills.
Fine grained igneous rocks, e.g. aplites can be good aquifers because they have short and narrowly spaced fractures. While coarse grained rocks like granites, have long and widely spaced fractures forming a mosaic of splinths. The storativity is reasonably good between the splinths. Basic intrusive rocks, e.g. diorites and gabbros have low and tend to be poor aquifers.
(b) Hydrogeological considerations
The water resources study of the hydro-geological conditions of the project area will
indicate the viable sites for well exploration in terms of supply capacity and
water quality. Hydro-geological studies should be conducted by knowledgeable
professionals or drillers, who assess available information on existing wells.
Professionals should examine well data such as
- water quality,
- well yield,
- seasonal fluctuations,
- water table depth, and
- well drilling logs showing geologic layers.
A geo-resistivity survey of the areas being considered for possible well sites will indicate the depth and thickness of aquifers.
Wells can be designed and constructed in a number of ways depending on the geological condition, budget for the construction and the desired capacity of the well. The following are the types of wells that can be identified based on the construction methods employed.
(i) Dug wells
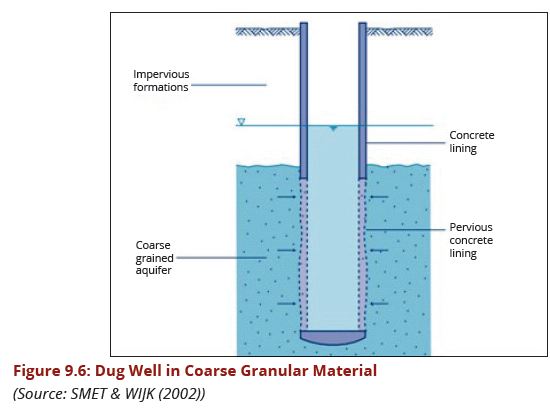
Dug wells are holes or pits dug manually into the ground to tap the water table.
The dug well may be up to 15 meters deep, with diameter usually ranging from
1 meter to 1.5 meters. The well is usually lined with concrete masonry, bricks,
stones, or reinforced concrete to prevent the wall from caving in. At depths of the
aquifer layer, the wall is embedded with slots; or prefabricated concrete caisson
rings are installed for the passage of groundwater into the dug well. Dug wells
are normally circular in shape (Figure 9.6). This type of well is sometimes capable
of drawing sufficient supplies of water from shallow sources but is easily polluted
by surface water.
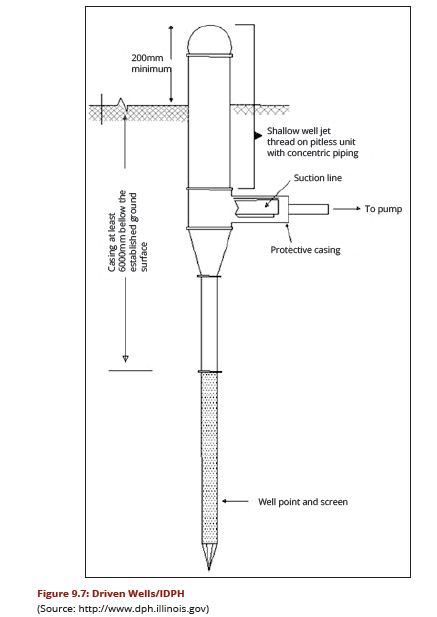
(ii) Driven wells
Driven wells are like dug wells, in the sense that they tap the shallow portion of the
unconfined aquifers (Figure 9.7). They are easy and relatively inexpensive to
construct in locations with unconsolidated formations that are relatively free
of cobbles or boulders. The wells are constructed by driving to the ground an
assembly of Galvanized Iron (G.I) pipe and a pointed metal tube called a “well
point”. The pointed end of the well point, which is the penetrating end, has
screens or holes to allow the passage of water.
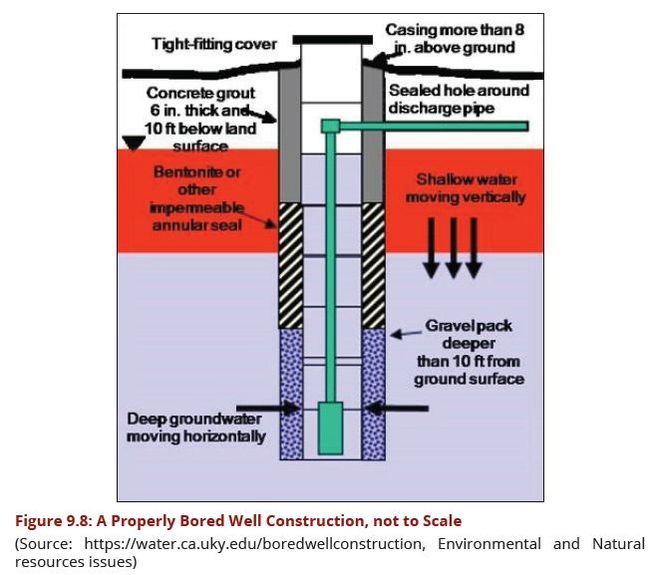
(iii) Bored wells Bored wells are constructed with hand or power augers, usually into soft cohesive or non-caving formations that contain enough clay to support the boreholes. The depth of bored wells could be up to 15 metres. Bored wells are very prone to surface contamination. The well construction method is not applicable on hard consolidated materials and is not advisable on predominantly boulder formations. Figure 9.8 shows a properly bore well.
