DCOM Volume I Appendix J
APPENDIX J:BASIC STATISTICS USED IN ESTIMATION OF DESIGN OF FLOOD EVENTS
Generally, the basic statistics such as mean, standard deviation, variation coefficient and skewness coefficient give basic information on data.
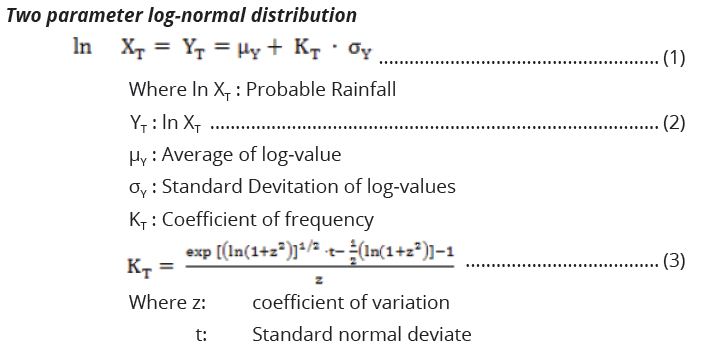
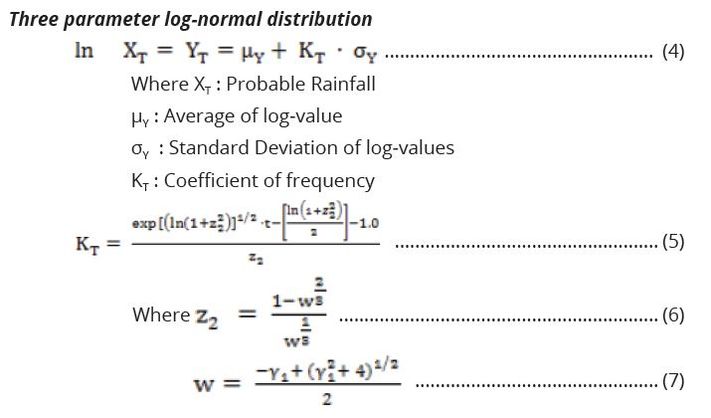
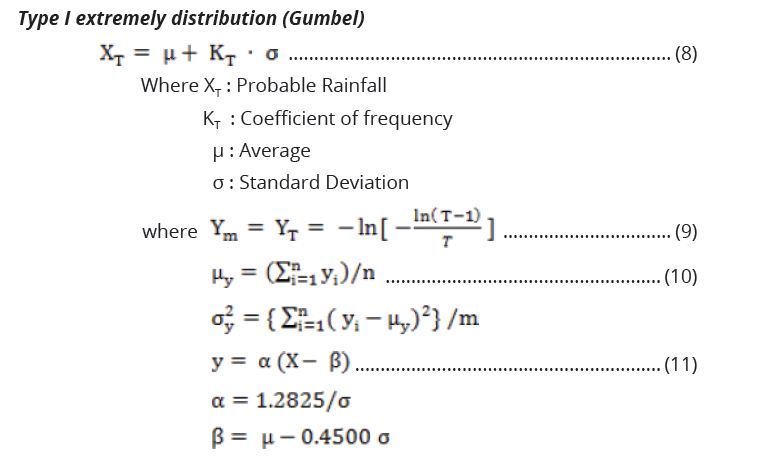
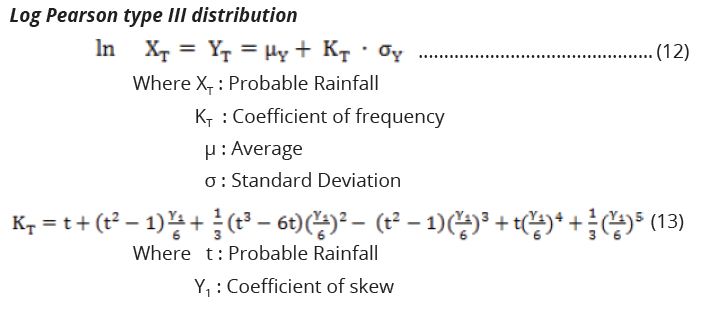
Distributions The daily maximum rainfall for a given return period is obtained through methods such as two-parameter log-normal, three-parameter log-normal, Gumbel, type III log-person distributions as expressed here below.
Testing the goodness of fit
Three goodness-of-fit tests are described in the manual. Note that X denotes the
random variable and; n, the sample size.
The tests are as follows:
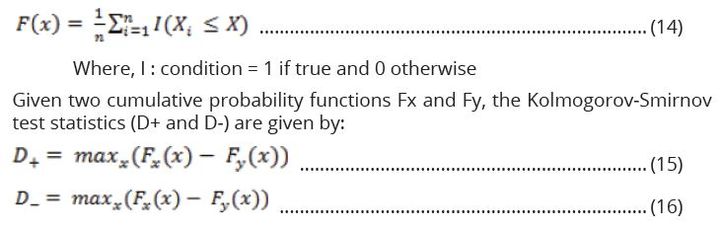
Kolmogorov-Smirnov (K-S) test
This test is used to decide if a sample comes from a hypothesized continuous
PDF. It is based on the largest vertical difference between the theoretical and
empirical CDF. For a random variable X and sample (x1, x2, .......xn) the empirical
CDF of X (Fx(x)) is given by:
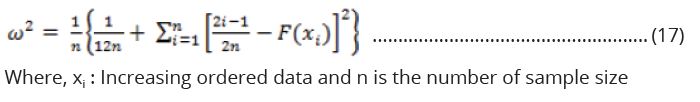
Cramer-von-Mises (CVM) test
The criterion is a form of minimum distance estimation applied in judging the
goodness-of-fit of a probability distribution compared to a given empirical
distribution function in statistic.
The definition of CVM is given as follows:
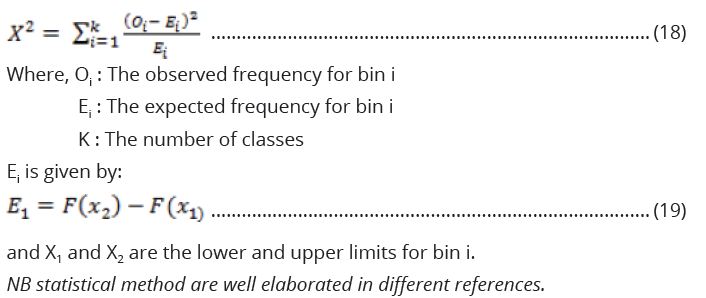
Chi-squared (C-S) test
This test simply compare show well the theoretical distribution fits the empirical
distribution PDF. The C-S test statistic is given by:
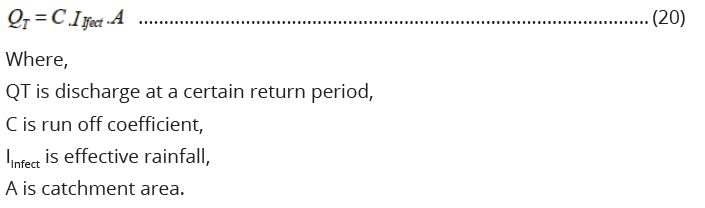
The estimation of design flood (peak discharge) is by using Rational method.
The rational method is one of the useful methods deployed in discharge scarce rivers. The major limitation of the method is that it is deployed in the small catchments due to complicity of estimating the runoff coefficient for large area with different land uses. The governing question for rational method is expressed here below:
Procedure
The rainfall intensity at different return period is calculated by using combined
statistical and probabilistic formula. Estimation of the intensity at different return
period is determined by the following procedure:
The set of daily rainfall data collected from a station which is located is within the catchment or close to the catchment having similar rainfall patterns is used. From the daily rainfall data, 2, 5 and 10 days rainfall were derived.
Frequency analyses of the rainfall extreme event are performed based on classified rainfall events at constant class interval. P=n/nt and T=1/P whereby; n=number of occurred extreme event, nt = total number of chances (total number of years) T=Return period and P=Probability
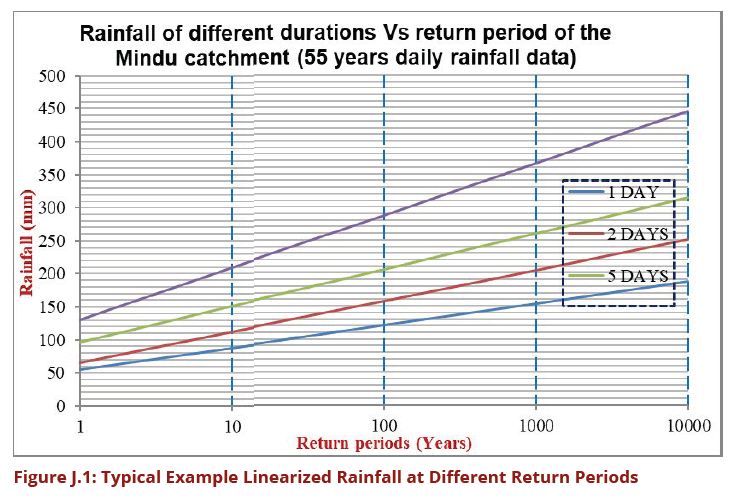
The classified rainfall in mm against return period should be plotted on the semi logarithmic scale and resulted on a straight line which make easier extrapolation of higher return periods (see Figure J.1).
The extrapolated rainfall is converted to different rainfall duration (i.e. 1, 2, 5 and 10 days rainfalls) so that to be plotted with their respective return periods.
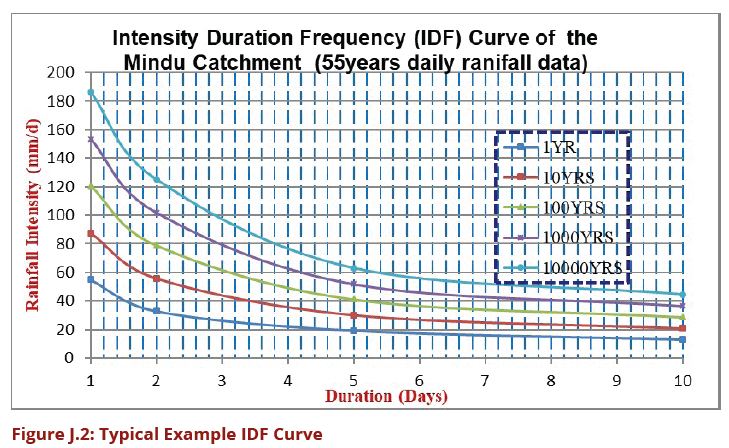
The return periods of 1 to 10,000 are used during the preparation of the IDF Curve. Then, after the corresponding intensities at different return period are estimated as illustrated on Figure J.2.
Rainfall Runoff Coefficient (C)
Rainfall coefficient is the ratio of runoff and total precipitation over the catchment.
The coefficient covers all loses due to infiltration, evaporation, land cover and other
related. The coefficient should be estimated based on the available hydrological
reference. After estimating runoff coefficient, runoff of the catchment area may
be computed at the different return periods.
Previous Page: DCOM_Volume_I_Appendix_I << >> Next Page: DCOM_Volume_I_Appendix_K